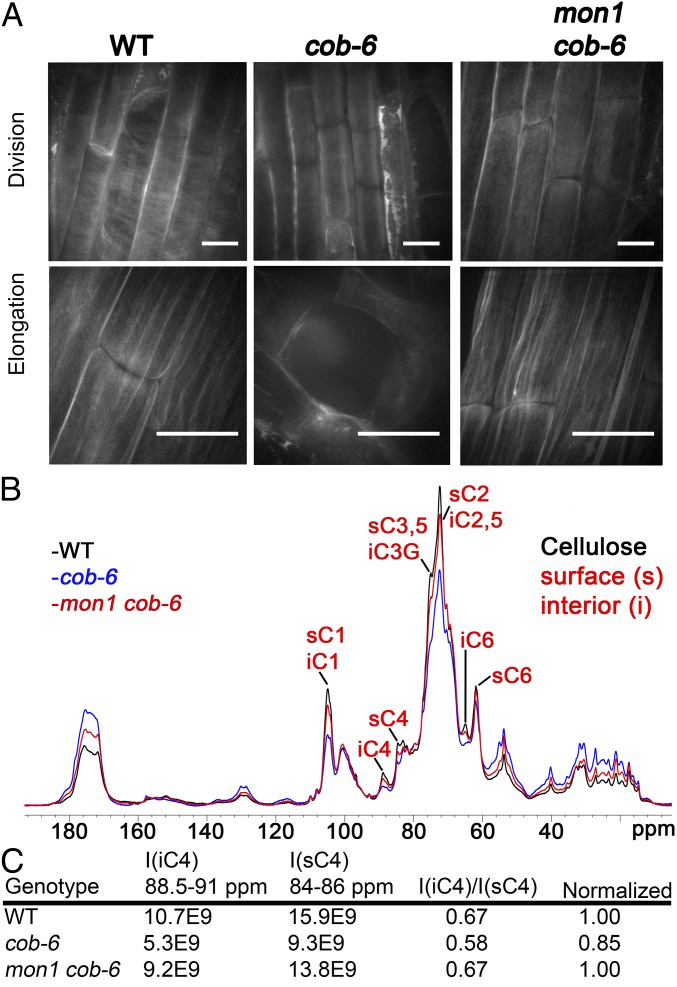
Fig. 2.
Cellulose macrostructure and amount in mon1 cob-6 mutant. (A) Cellulose in root cells stained with S4B. In cob-6, staining is reduced and less homogeneous, with some cells exhibiting almost a complete lack of fluorescence. Fibrils that can be detected are not as defined as in wild type, and are not as regularly oriented (Upper, cob-6). In mon1 cob-6, fibrils were similar to wild type, more so in elongated cells. (Scale bars, 15 μm.) (B) One-dimensional ssNMR analysis. Quantitative 13C direct polarization (DP)-MAS ssNMR spectra of wild-type, cob-6, and mon1 cob-6 cell walls. Additional annotation is shown in Fig. S8. (C) Relative intensities of interior and surface cellulose C4 signals from 13C DP-MAS spectra.

