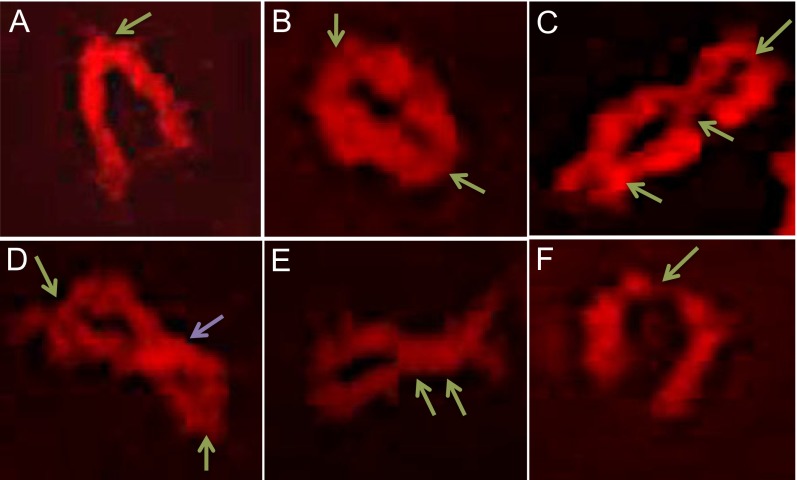
Fig. S1.
Quantification of chiasmata in maize. Chiasmata were identified using a combination of chromosome spreading and 3D image reconstruction. (A) Typical morphology of a rod bivalent with a single chiasma at a chromosome end. (B) A ring bivalent with two chiasmata, one at each end. (C) A ring bivalent with three chiasmata, two terminal and one interstitial. (D) A bivalent with two terminal chiasmata and a chromosome twist. (E) A bivalent with two chiasmata located close to each other. (F) A bivalent with a poorly visible terminal chiasma that could make the bivalent be confused for two univalents. Chiasmata are indicated by green arrows. A chromosome twist is indicated by a purple arrow.

