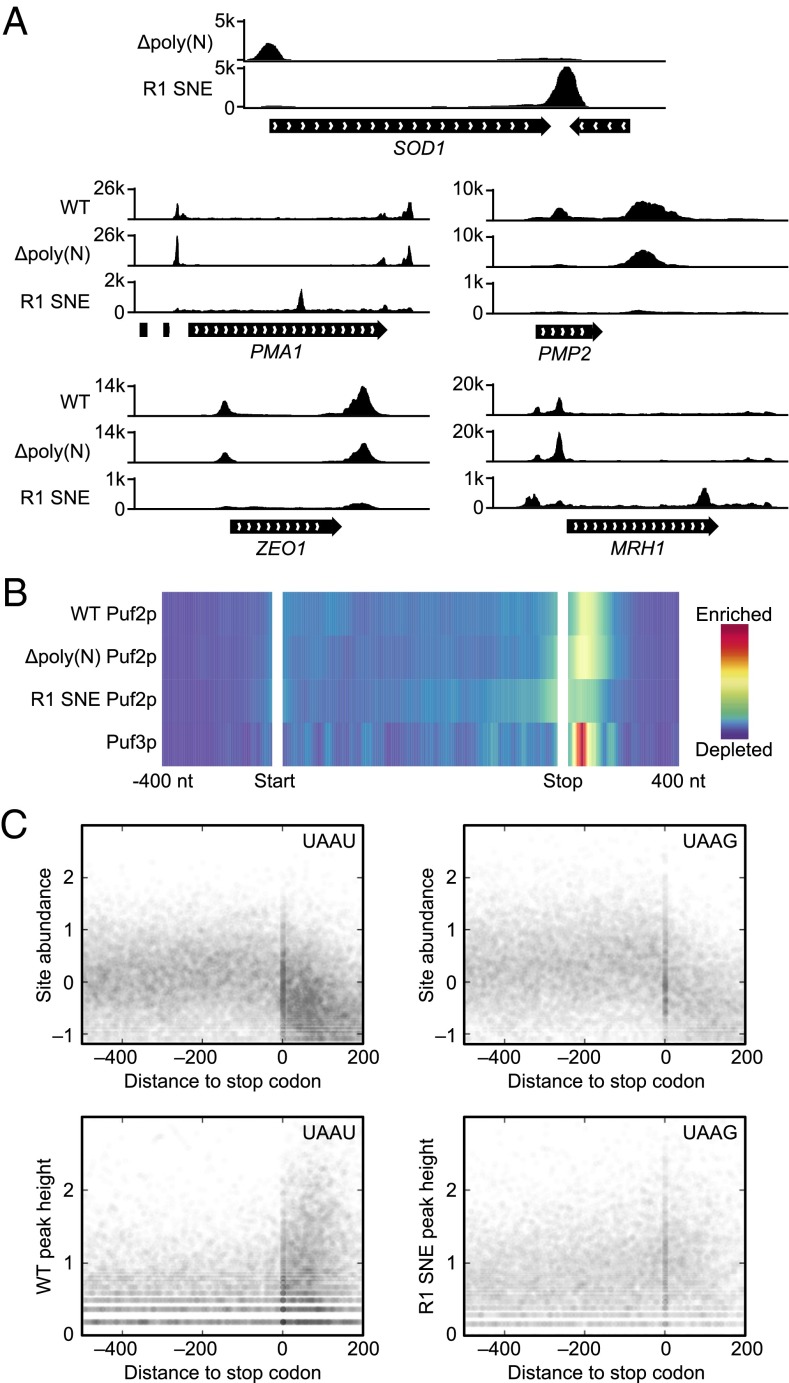
Fig. 7.
The designer PUF R1 SNE Puf2p follows its motif locations. (A) An alteration of Puf2p specificity results in different patterns in different mRNA. SOD1 is the top R1 SNE Puf2p target. R1 SNE Puf2p changes from a 5′UTR to 3′UTR binding site in SOD1 upon redesigning its specificity. The top four targets of WT Puf2p are also pictured. (B) WT Puf2p binding peaks in the 3′UTR, whereas R1 SNE Puf2p binding peaks over the stop codon and decays roughly symmetrically on both sides. Color represents averaged signal strength across all targets, with the CDS normalized to 1 kb. (C) UAAU motifs are clustered in 3′UTRs, whereas UAAG motifs are not. UAAU or UAAG motifs (counting overlapping sites as two sites) in mRNA are depicted as a scatter plot. The y axis is log10 reads per million. The x axis is the distance to the stop codon in nucleotides, with positive numbers in the 3′UTR. RNA-seq signal is given at Top, followed by coverage from Δpoly(N) Puf2p (WT), and R1 SNE Puf2p at Bottom.

