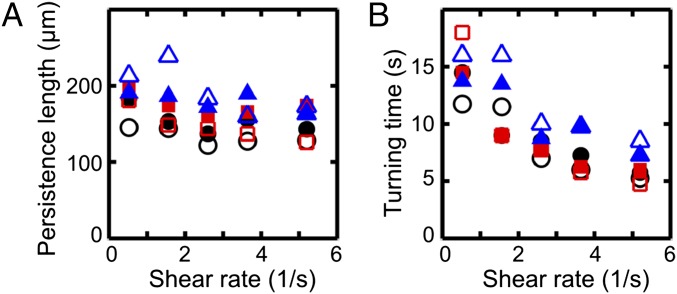
Fig. 2.
Characteristics of the turning process for the cell trajectories in Fig. 1, using the same color coding for viscosities, with filled (unfilled) symbols indicating right-turning (left-turning) trajectories. (A) The persistence length , defined as the maximum of the x component of each mean trajectory in Fig. 1A, shows weak variation with shear rate . (B) The mean turning time T, defined as the time after which the x component of a mean trajectory reaches its maximum, is approximately inversely proportional to the shear rate, .

