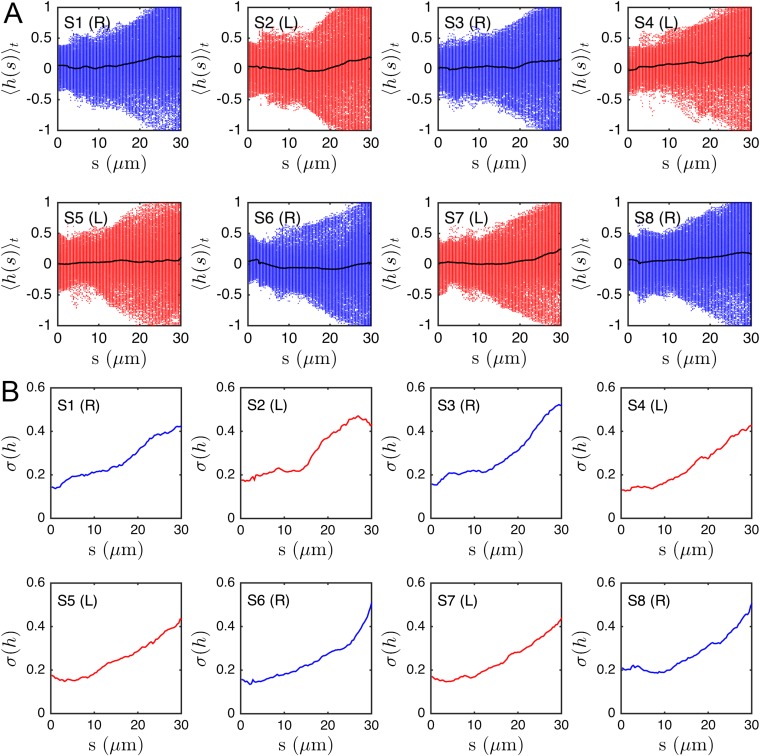
Fig. S9.
(A) Black lines show time-averaged local helicity, , along the flagellum for eight representative samples. Individual data points from each frame are shown to illustrate the spread over time (red, left-turning; blue, right-turning), indicating no persistent helicity. Although a slight tendency toward positive average helicity values is observed near the posterior parts of the flagellum, this bias does not correlate with the turning direction. (B) Helicity SD along the flagellum.

