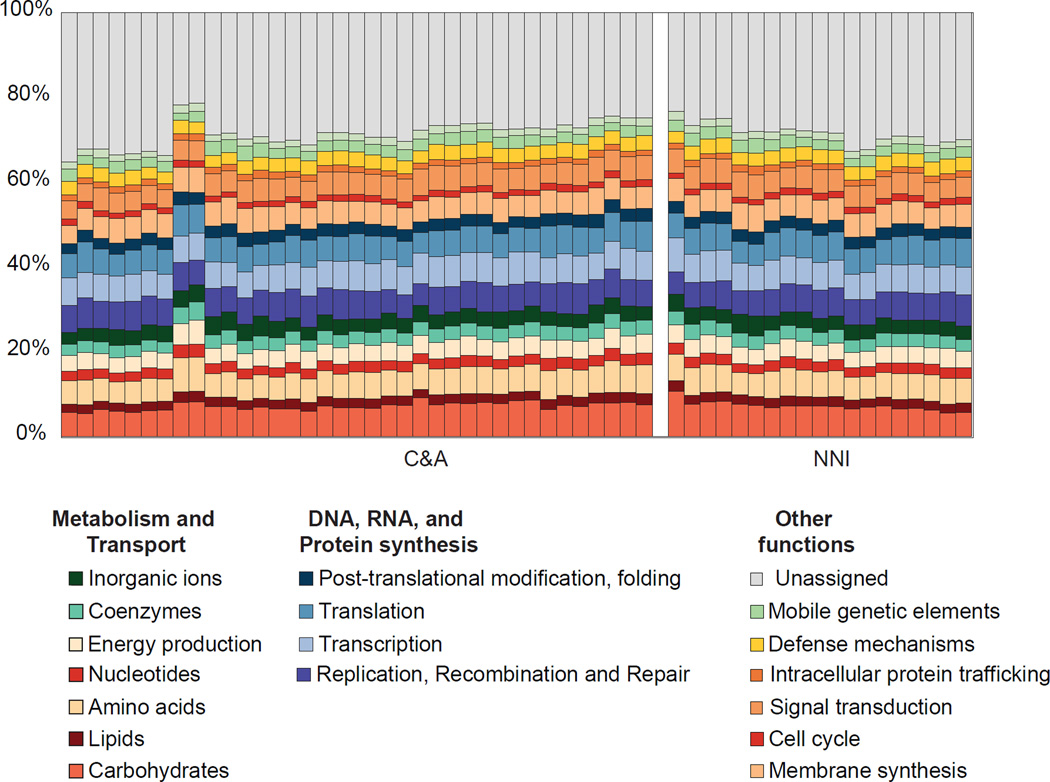
Figure 3. Summary of gut microbiome functional potential generated from COG annotation of assembled contigs.
Within the C&A and NNI, individuals are hierarchically clustered. Analyses were performed on COG tables rarefied to a total contig abundance of 1,000,000 per individual. Assembly and annotation statistics are provided in Table S3.

