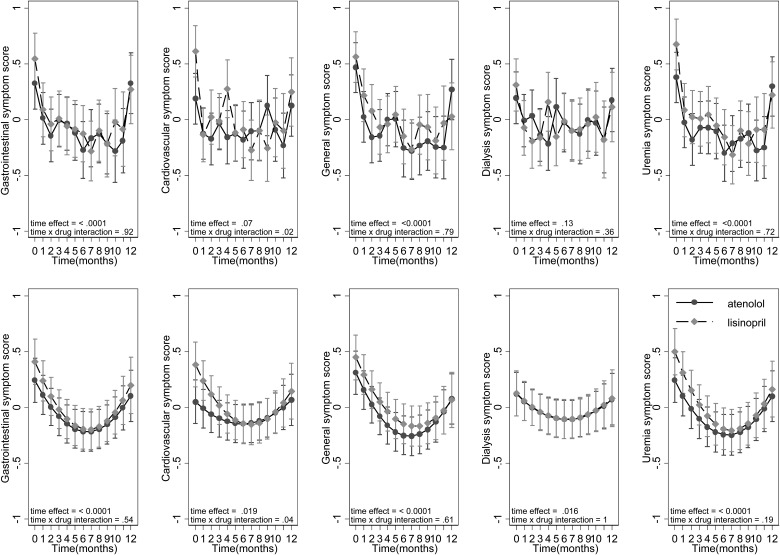
FIGURE 2:
Symptom score over time in the randomized trial. Scores are standardized to have a mean of 0 and SD of 1 to facilitate comparison across groups. High scores represent more symptoms. The top five graphs show time as an indicator variable, whereas the bottom five treat time as a continuous variable with a quadratic term added for time. Marginal modeled means are shown with their standard errors. Significant improvement was seen with time in all but dialysis-related symptoms. Time effect reflects the P-value of time, while time × drug interaction is the P-value of the interaction term.

