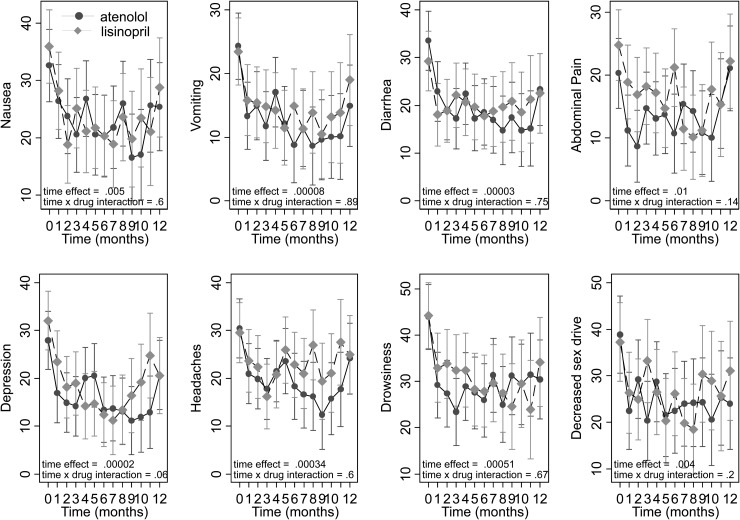
FIGURE 3:
Graph of eight individual symptoms that showed improvement over time. Treatment × time interaction was not significant, indicating no unique effect of the drug. All gastrointestinal symptoms (top four graphs) and general symptoms (next three graphs) showed improvement, as did sex drive. The last symptom was not included in the CFA model. Marginal modeled means are shown with their standard errors. All symptoms are scaled from 0 to 100, where 100 represents most symptoms.

