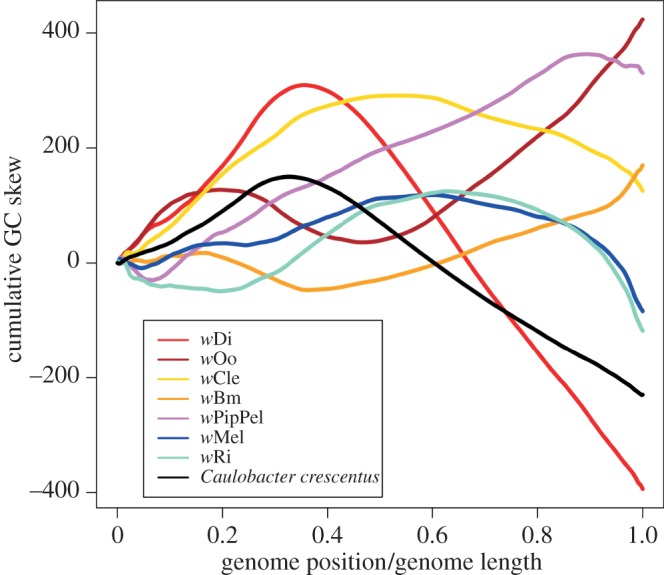
Figure 3.

Cumulative GC skew curves. GC skew was calculated with window size of 1000 nucleotides and step size of 100 nucleotides. The curve for Caulobacter crescentus is coloured in black, whereas the curves for Wolbachia strains are coloured as follows: wMel, blue; wRi, azure; wPipPel, pink; wDi, red, wOo, dark red; wBm, orange; wCle, yellow.
