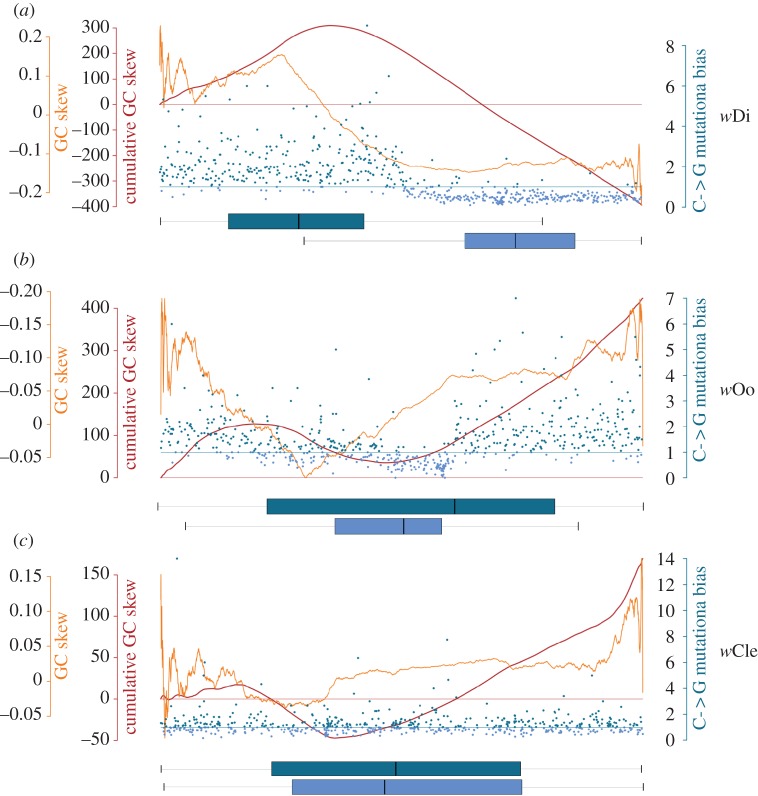
Figure 5.
GC mutational bias. The figure displays information about the (a) wDi, (b) wOo and (c) wCle genomes, including GC skew, cumulative GC skew and mutational bias calculated using the wBm genome as reference (see Material and methods). In each graph, the position along the genome is reported on the x-axis; the GC skew curve is reported with an orange line and the cumulative GC skew with a red line. Genes shared among all the Wolbachia strains included in the study are represented with blue/azure coloured points: blue genes have a positive GC mutational bias index, whereas azure genes have a negative GC mutational bias index (see Materials and methods). The horizontal boxplots indicate the average position of genes with positive GC mutational bias index (blue) and with negative GC mutational bias index (azure).

