Figure 2.
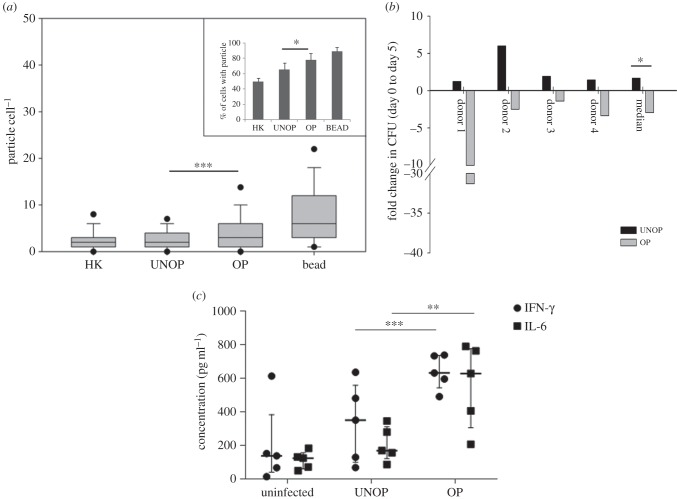
Particle uptake, intracellular killing of Mtb and production of proinflammatory cytokines by donor macrophages. Panel (a) shows number of fluorescent particles (HK, heat-killed Mtb; UNOP, unopsonized Mtb; OP, opsonized with heat-inactivated autologous sera; bead, polystyrene beads) per cell and (inset) % cells with at least one particle after 3 h of internalization. The box and whisker plot represents median and 5th–95th percentile values for five donors and bar diagram (inset) represents mean ± s.e. values of pooled data from 500 cells (100 from each of the five donors). Panel (b) shows fold change (between days 0 and 5) in viable counts (cfu) of UNOP and OP Mtb within the macrophages from four donors. Individual as well as median values are represented by the bar graph. Panel (c) shows IFN-γ and IL-6 production (median, interquartile range and individual values) by the uninfected and infected macrophages of five donors. Significance of differences between OP and UNOP clusters (indicated by horizontal lines) were: *p < 0.05, **p < 0.02, ***p < 0.01.

