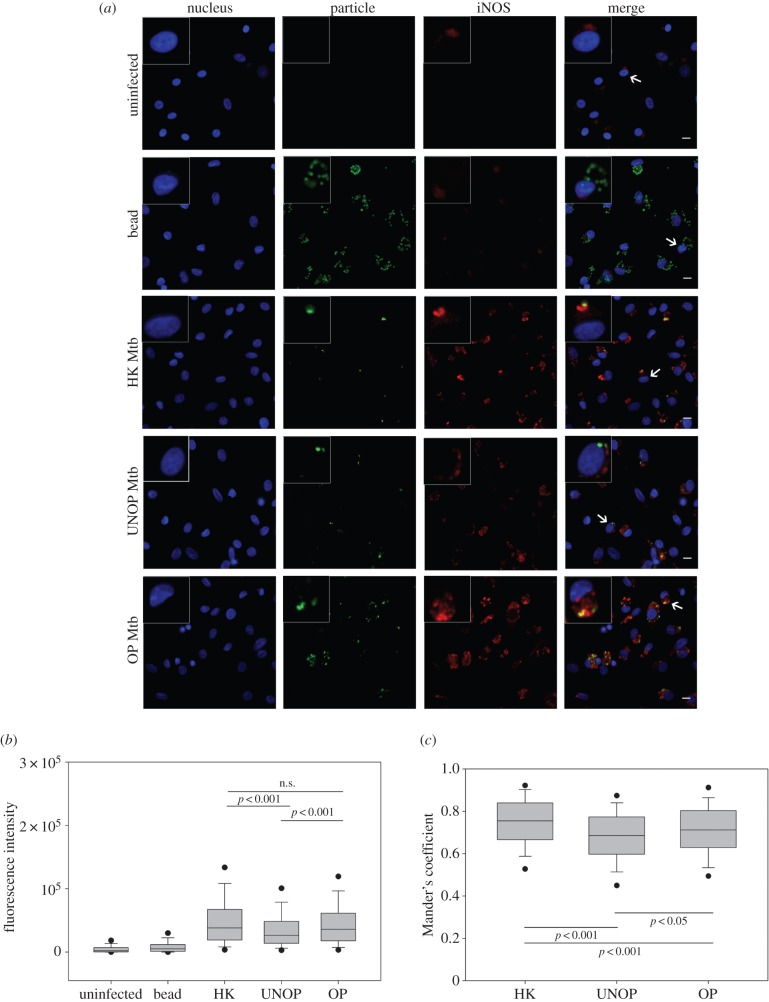
Figure 6.
Opsonization with serum Abs enhanced colocalization of Mtb with iNOS. Cells were allowed to internalize fluorescent beads or Mtb (HK/UNOP/OP) and iNOS was detected by immunofluorescence. Panel (a) shows representative images (with 40× objective), including enlarged view of one cell (indicated by arrows) in the insets. Scale bar is 10 µM. Panel (b) shows whole-cell intensity of iNOS under different conditions. The box and whisker plot (median and 5th–95th percentile values) represents pooled data of 500 cells (100 cells from each donor, each cell with at least one particle). Panel (c) shows degree of recruitment of iNOS on bacilli measured as Mander's coefficient. The box and whisker plot represents median and 5th–95th percentile values of pooled data of 250 cells (50 cells from each donor, each cell with at least one bacillus). The p-values are also depicted in panels (b) and (c). (n.s., not significant, p > 0.05.)

