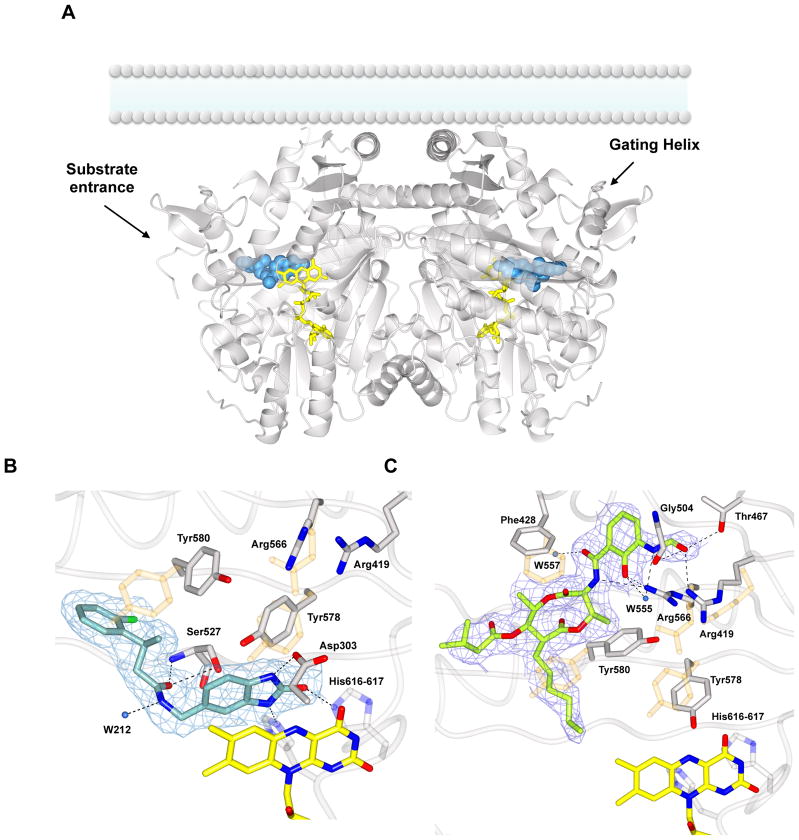
Figure 2. Structural studies on Cavia porcellus AGPS in complex with the inhibitors 1a and Antimycin A.
(A) Overall view of the dimeric enzyme bound to 1a (blue spheres). The inhibitor is extended along the hydrophobic substrate tunnel, delimited by the “gating helix” (residues 126–137). AGPS is known be associated to the lumenal side of the peroxisomal membrane as outlined in the figure [9]. FAD is shown in yellow. The overall rms deviation between the unbound protein (PDB entry 4bby) and the inhibitor complex is 0.36 Å. (B) Weighted 2Fo-Fc final electron density map contoured at 1.2 σ level for 1a in the same orientation of the left subunit shown in Figure 2A. Binding involves specific H-bonds (black dashed lines) with the catalytic residues Tyr580, His616, and His617. The position and the distance of the inhibitor suggest also π interactions with the cofactor isoalloxazine ring. A few side chains change their conformation with respect to the unbound enzyme (light orange). (C) Final weighted 2Fo-Fc map (1.2 σ contour level) for Antimycin A-enzyme complex. The electron density is fully consistent with Antimycin A1 (6-carbon alkyl moiety) being bound to the protein. Inhibitor binding causes the rearrangement of several residues around the active site (in orange superposition with native AGPS residues).

