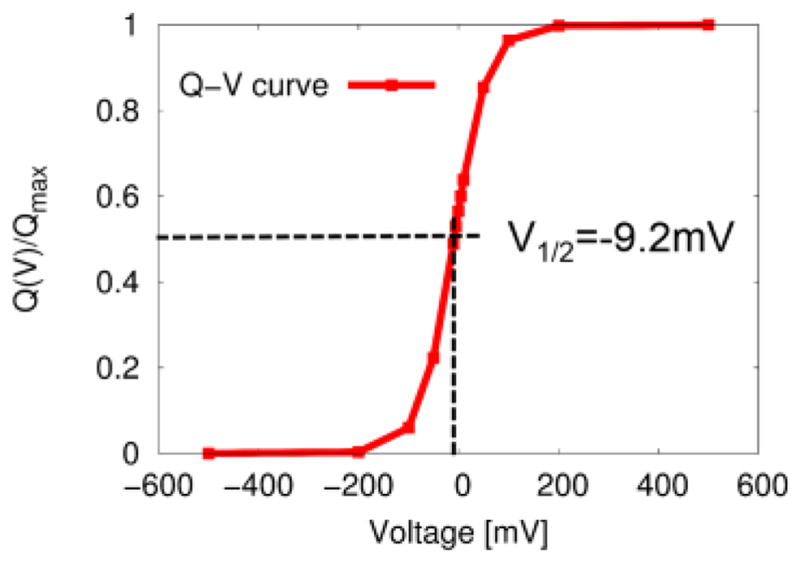
Figure 5.

The voltage dependent open (activated) probability (Q-V curve) obtained using the CG model of voltage coupling (see Fig. 4A) with pλ(V) ∝ exp(−Δfλ(V)). The lease square fit of the voltage dependent open (final state) probability density of Eq. (58) to the analytic form of Q-V curve of Eq. (59) yields the half voltage (V1/2) of ~ −9.2mV and gating charge of ~− 0.78e, resulting in the chemical component of free energy of ~0.2 kcal/mol using ΔGc≡g0(0)− g1(0))=QgV1/2. As expected from Eq. (21), ΔGc is approximately equal to the free energy difference (~0.2 kcal/mol) between the two equilibrium conformational states along a reaction coordinate of voltage activation, i.e., Δf1(V1,min)−Δf1(V0,min).
