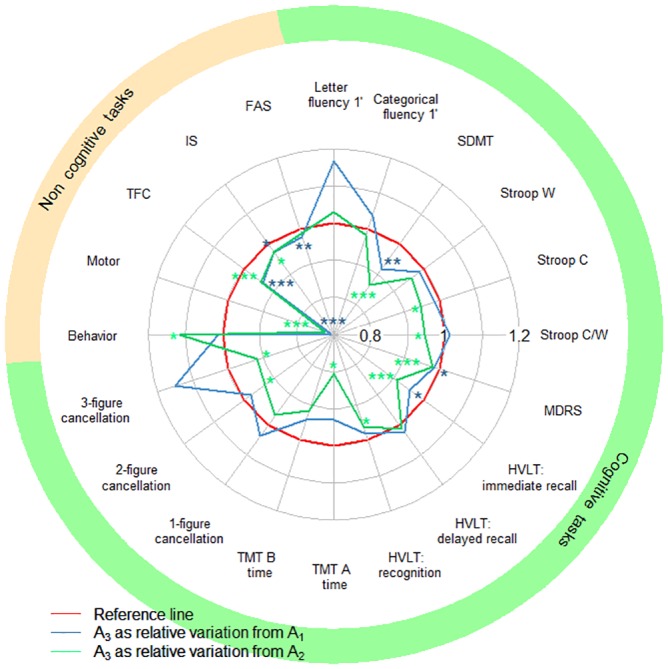
Fig 2. Observed performance at one year (A3), with A1 or A2 used as the baseline, in the MIG-HD cohort.

SDMT: Symbol Digit Modalities Test; Stroop C, W and C/W: Stroop color, word and color/word interference; MDRS: Mattis Dementia Rating Scale; TMT A, B: Trail-Making Test A and B; TFC: Total Functional Capacity; IS: Independence Scale; FAS: Functional Assessment Scale. The red curve represents the baseline (reference score). The blue (or green) curve corresponds to the mean relative score one year later (A3), with A1 (or A2 for the green curve) used as the baseline. A green curve within the blue curve indicates that the decline was easier to detect if A2 was used as the baseline, rather than A1. Paired t-tests, significance: * P<0.05, ** P<0.01, *** P<0.001.
