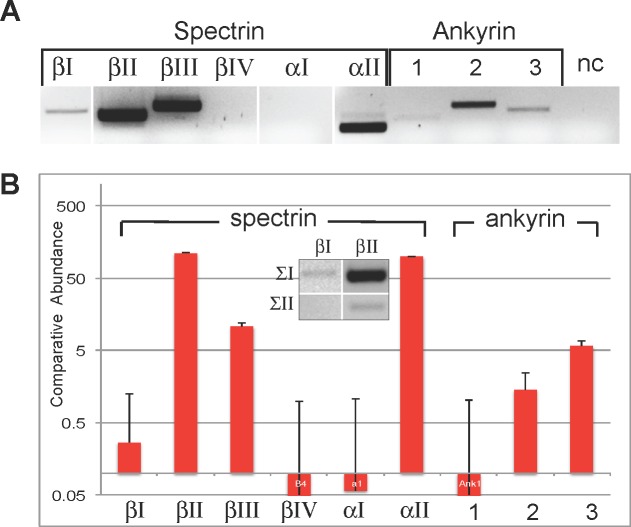
Fig 1. Spectrin and ankyrin mRNA in mouse kidney.
Spectrin and ankyrin mRNA expression were measured by RT-PCR and qPCR with primers summarized in Table 1. (A) Amplimers were detected for spectrins βΙ, βΙΙ, βΙΙΙ, and αΙΙ and for ankyrins R (Ank1), G (Ank2), and B (Ank3). NC is no-RNA control. (B) The levels of the various transcripts varied widely, as measured by qPCR. Relative abundance is presented. Results shown for three separate determinations. Error bars ±1SD from mean. (Inset) RT-PCR detected two alternative transcripts of βΙΙ spectrin (βΙΙΣ1 & βΙΙΣ2), but only one of two potential transcripts of βΙ spectrin.

