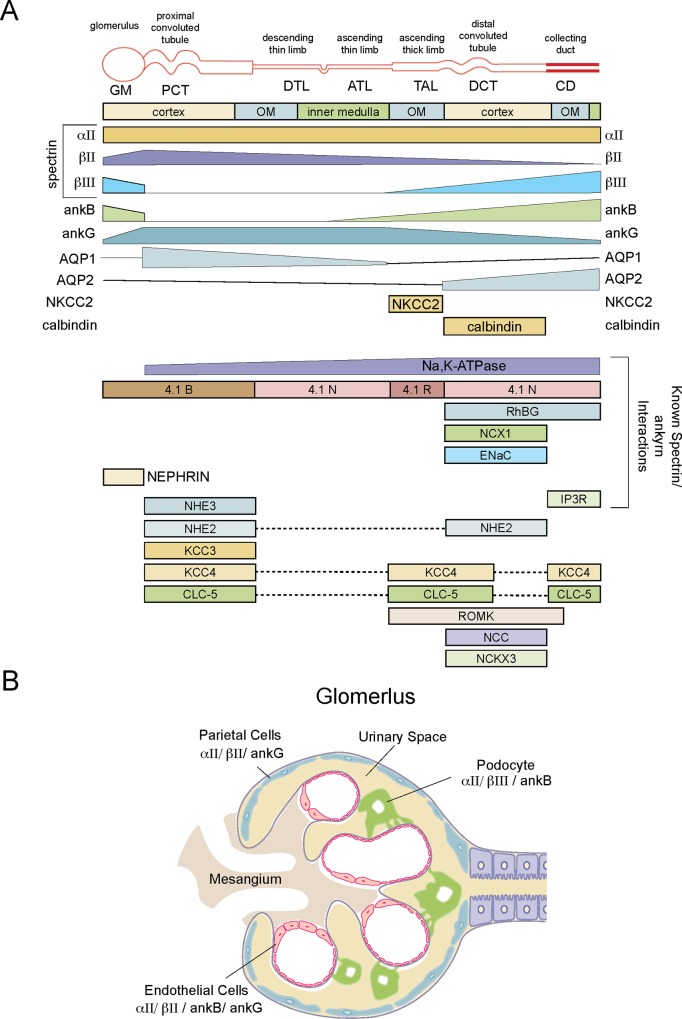
Fig 10. Cartoon depicting the distribution of renal spectrin and ankyrin and their relationship to other membrane proteins.
The relative abundance of the proteins studied here is an estimate based on their localization and relative intensity of fluorescent staining. The distribution of the other proteins is derived from the published literature. While a variety of membrane and adapter proteins have been noted to interact with spectrin or ankyrin, no simple mapping of one protein to another is evident. The citations for the depicted distributions were as follows: AQP1,2 [28]; NKCC2 [32, 33]; calbindin1 [31]; protein 4.1 [2]; RhBG [61, 62]; NCX1 [63]; ENaC [64, 65]; IP3R [66, 67]; NHE3 [68]; NHE2 [68]; KCC3 [69]; KCC4 [69]; ClC5 [70]; ROMK [71]; NCC [64]; NCKX3 [72].

