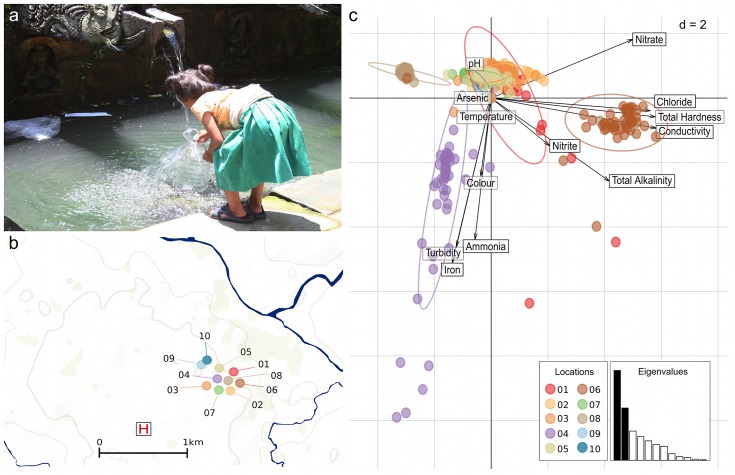
Fig 1. The physical and chemical properties of water from ten sampling locations in Kathmandu, Nepal.
a) Photograph of child collecting water from a traditional stone waterspout (dhunge dhara) in Kathmandu. b) A map showing the location of the ten sampling locations in Kathmandu. The locations are color-coded corresponding to other figures and the site of Patan hospital (the healthcare facility for those with typhoid fever) is highlighted by the H symbol. (See Table 1 and Baker et al. [6] for more details regarding the sampling locations and the mapped area). c) Scaled principal components analysis of the physical and chemical properties of water samples from the ten sampled locations, showing the first two principal components (PC1-2). Individual water sample are identified by dots colored according to their sampling location (see Fig 1a). Inertia ellipses indicate the overall distribution of each water source. Labeled arrows indicate the relative contributions of the variables to the principal components, with longer arrows reflecting larger contributions. The screeplot of eigenvalues (inset) indicates the amount of variation contained in the different principal components, with PC1 and PC2 indicated in black.

