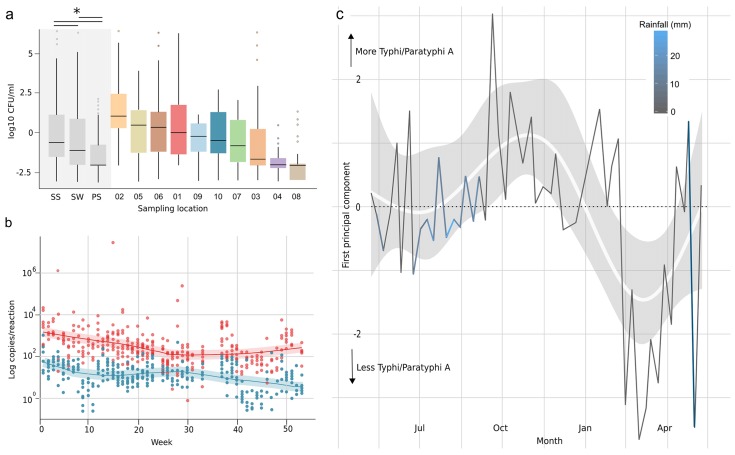
Fig 2. The quantification of coliforms and DNA from Salmonella serovars Typhi and Paratyphi A in water samples from ten locations in Kathmandu, Nepal.
a) Boxplots of the MPN counts (log10 CFU/ml) aggregated by water sources type (SS, stone spout; SW, sunken well; PS, piped supply) and within each individual location (numbered on x-axis). Boxes and horizontal lines represent the interquartile ranges and medians, respectively and whiskers represent 90% of data range. The median MPN measurements in water from stone spouts; sunken wells and piped supplies were significantly different; as determined by Kruskal Wallis test (p<0.001; shown by the asterisk). b) Scatterplots showing the number of copies of S. Typhi (red circles) and S. Paratyphi A (blue circles) gene targets calculated to be in each water sample (by realtime PCR amplification and quantification using a standard curve) against the week of sampling. The red and blue shaded lines show the best fit through time of gene copy quantification trends for S. Typhi and S. Paratyphi A, respectively. c) Principal components analysis of the weekly presence/absence profiles of S. Typhi and S. Paratyphi A gene targets in water samples, shaded by weekly rainfall (see key). Time is represented on the x-axis. The first principal component, representing fluctuations in S. Typhi and S. Paratyphi A DNA relative abundance, is plotted on the y-axis.

