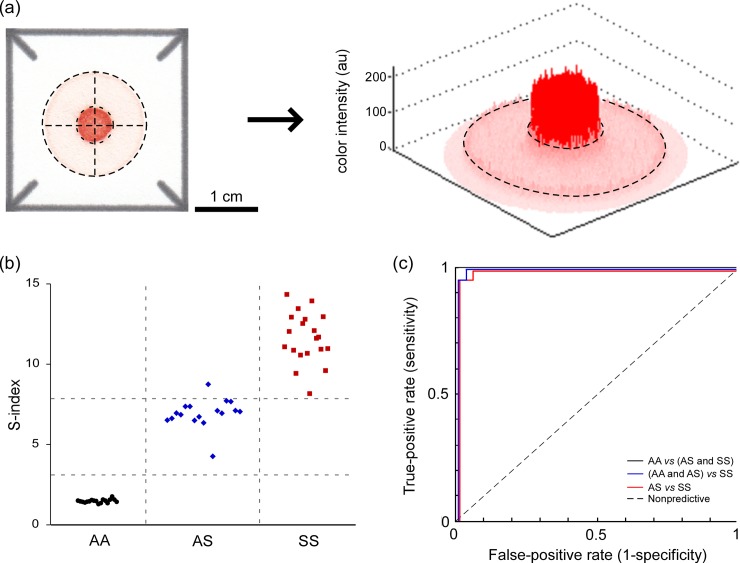
Fig 3. Automated analysis of blood stains in paper.
(a) A custom image analysis algorithm automatically detected the center of each blood stain (dashed crosshair) and extracted the RGB values for all pixels contained within the dark red center spot (smaller dashed circle) and within the pink peripheral ring (area between the smaller and the larger dashed circles). The S-index was defined as the quotient of the mean red color intensity of the center spot and that of the peripheral ring of the blood stain. (b) The values of the S-index for (●) HbAA (n = 18), (♦) HbAS (n = 17) and (■) HbSS (n = 20) samples obtained from healthy subjects and patients in New Orleans, LA. (c) Receiver operating characteristic (ROC) curves for the use of S-index to identify HbAA, HbAS and HbSS samples. The area under the curve (AUC) for discriminating HbAA from HbAS and HbSS was 1.00, the AUC for discriminating HbSS from HbAA and HbAS was 0.9986 and the AUC for discriminating HbSS from HbAS was 0.9971.

