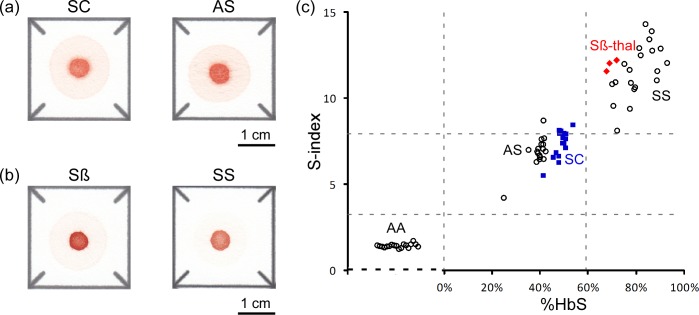
Fig 4. Diagnosis of other forms of sickle cell disease.
(a) Representative images of blood stains produced in paper by HbSC samples and by HbAS samples, for comparison. (b) Representative images of blood stains produced in paper by HbSβ+-thalassemia samples and by HbSS samples, for comparison. (c) Classification of HbSC and HbSβ+-thalassemia samples in the S-index domain. The values of the S-index for (○) HbAA, HbAS and HbSS samples (n = 55), (■) HbSC (n = 16) and (♦) HbSβ+-thalassemia (n = 3) are shown on Y-axis. The location along the X-axis of each data point for HbAS, HbSS, HbSC and HbSβ+-thalassemia samples corresponds to their %HbS measured with Hb electrophoresis by an off-site clinical laboratory. HbAA samples (n = 18) contained no HbS; hence the random lateral spread of the data points representing these samples on the plot.

