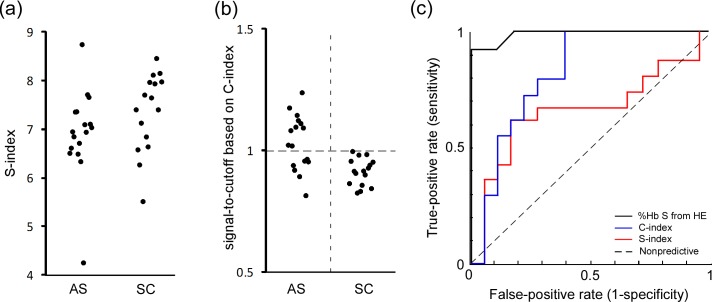
Fig 5. Differentiation of HbSC samples from HbAS samples via automated image analysis.
(a) The values of S-index for HbAS (n = 17) and HbSC (n = 16) samples. (b) Vertical scatter plots of C-index (normalized by cutoff values) for HbAS and HbSC samples. C-index was defined as the product of total color intensity of all pixels in the center area of the blood stain and average color intensity of all pixels at a distance of 5 mm from the center of the blood stain. (c) ROC curves for differentiating HbSC and HbAS based on (-) S-index, AUC = 0.67; (-) C-index, AUC = 0.82; and (-) %HbS by electrophoresis, AUC = 0.99.

