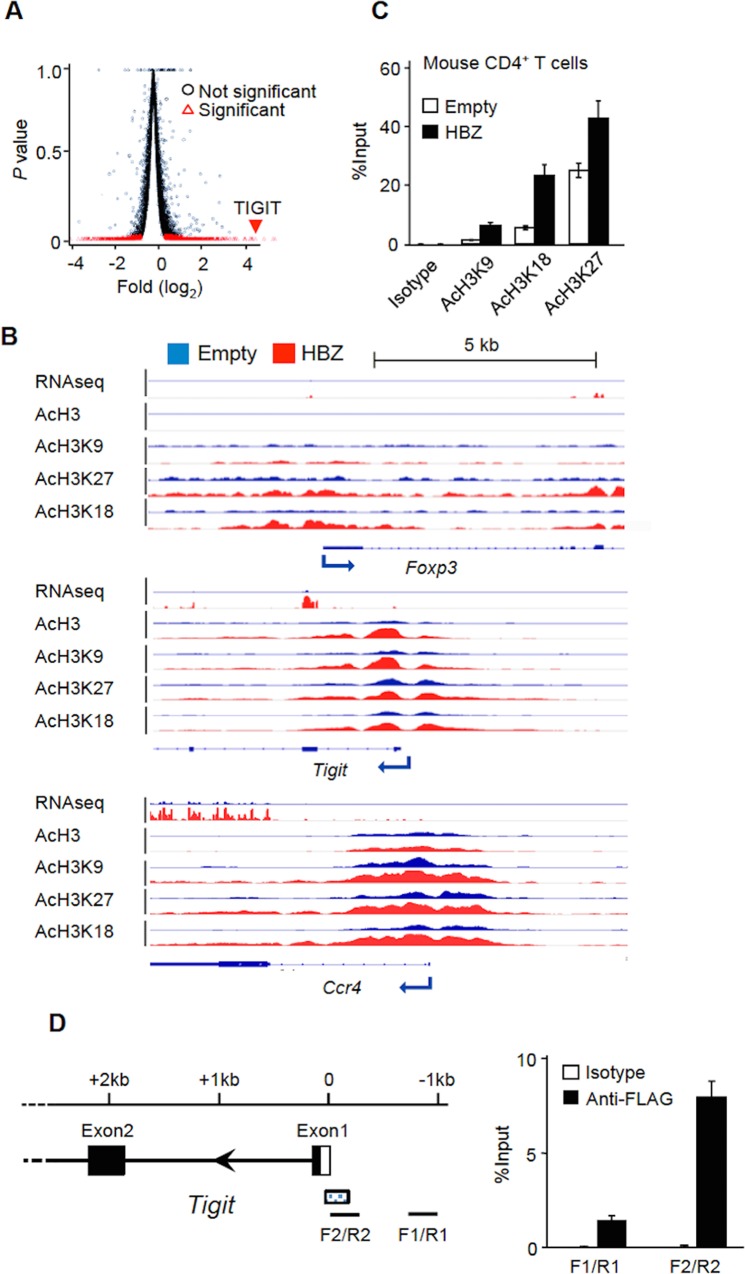
Fig 1. TIGIT transcription is regulated by HBZ.
(A) Volcano plots of p-value (y-axis) against log2 fold change (x-axis: HBZ expressing murine primary T cells vs. control cells) for RNA-seq data. (B) RNA-seq and ChIP-seq results of three Treg related genes. RNA-seq was performed twice and ChIP-seq was performed once for each. (C) The enrichment of the TIGIT promoter region by the indicated histone marks or isotype control was measured by ChIP-qPCR. The % input of HBZ expressing murine primary CD4+ T cells or control cells is shown. (D) The enrichment of the TIGIT promoter regions by anti-FLAG was analyzed by ChIP-seq in HBZ-FLAG expressing cells. The detected peak in the TIGIT promoter region was shown as the dotted box. The enrichment of the TIGIT promoter regions by anti-FLAG or isotype control was measured by ChIP-qPCR using the primers indicated. Results shown are the mean ± SD in triplicate (C, D).

