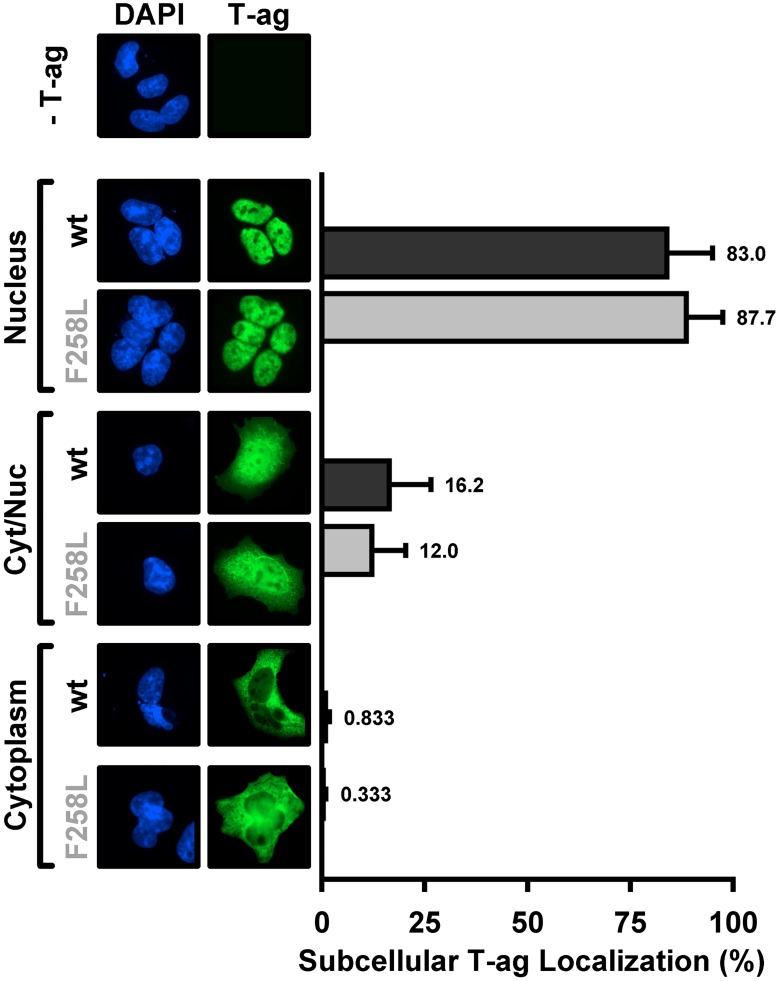
Fig 3. Subcellular localization of the JCV F258L T-ag mutant in C33A cells.
Immunofluorescent based comparison of the sub-cellular distribution of wt JCV T-ag, and the F258L mutant (both in green), within replication permissive C33A cells [46]. The cell nuclei were stained with DAPI. The histograms, based on the quantitation of ~ 100 such images, indicate the percentage of T-ag in nuclei, both nuclei and cytoplasm or just cytoplasm for the wt and mutant T-ags.

