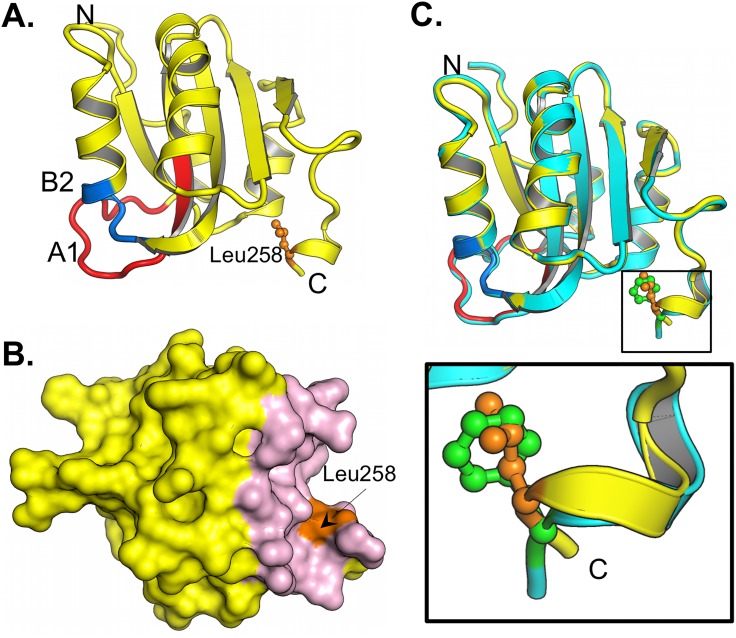
Fig 4. The structure of the F258L JCV T-ag OBD.
A. A ribbon diagram of the JCV T-ag OBD F258L monomer. The multifunctional A1 (residues 147–155) and B2 (residues 203–207) regions are labeled red and blue, respectively. Residue L258 is shown in orange. The N and C termini are indicated. B. A surface representation of the JCV T-ag OBD F258L monomer showing that presence of the C-terminal pocket (in pink) and the location of L258 (in orange). C. Superimposition of the F258L mutant (yellow) onto the wt JCV OBD (in cyan). The insert presents a close up of the superimposition of wt F258 (in green) onto L258 (in orange).

