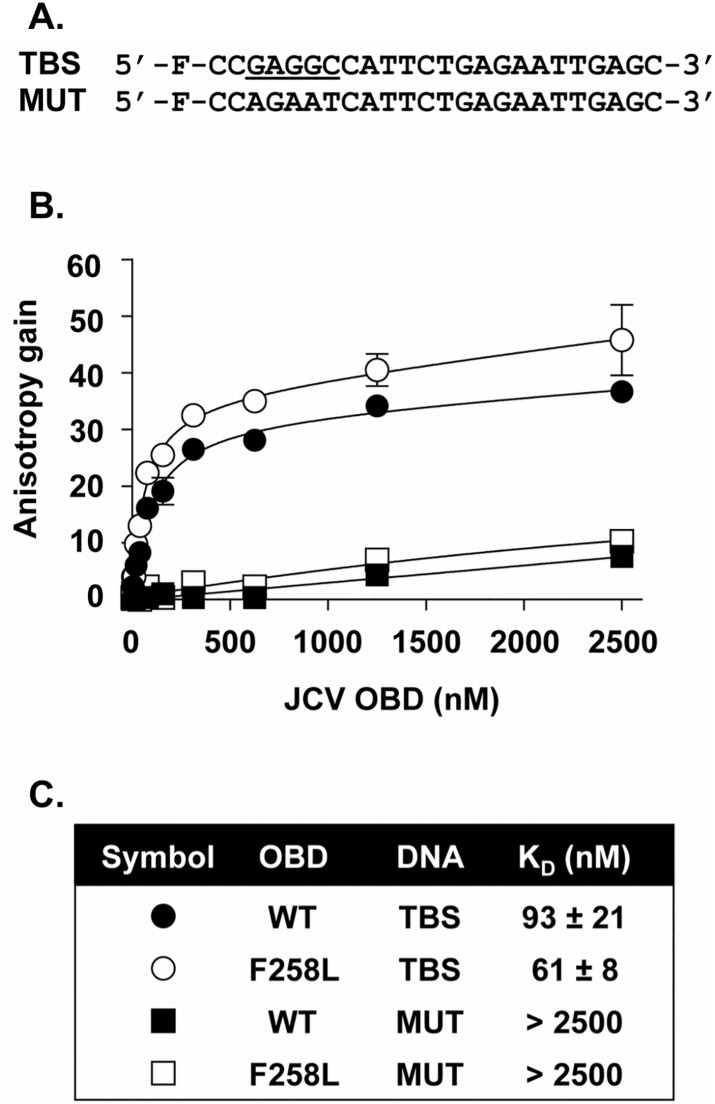
Fig 6. Measuring the ability of the wild type and F258L OBDs to Bind to DNA via Fluorescence anisotropy.
A. DNA probes used in these experiments. The nucleotide sequences of the probe containing a single T-ag Binding Site (TBS; (GAGGC underlined)), and of the control probe containing a mutated TBS (MUT) are indicated. “F” refers to the position of the fluorescein moiety. B. Binding isotherms were acquired with 15 nM of the TBS probe (circles) or control probe (squares), and increasing concentrations of the wild type (wt) OBD (filled symbols) or F258L mutant derivative (open symbols). Each data point is the average of two independent experiments, each performed in triplicate (n = 6). Some of the standard deviations are not visible on the graph as they are smaller than the symbols. C. KD values derived from the binding isotherms presented in B. Note, the JCV T-ag OBD, and the F258L mutant, bound to the single pentanucleotide containing probe more tightly than to the four pentanucleotide containing probe ((93 ± 21 nM and 61 ± 8 nM (Fig 6C) versus 172 nM and 193 nM (Fig 5B and 5C)). The reason for this difference is not understood; it may simply reflect the use of two different methods.

