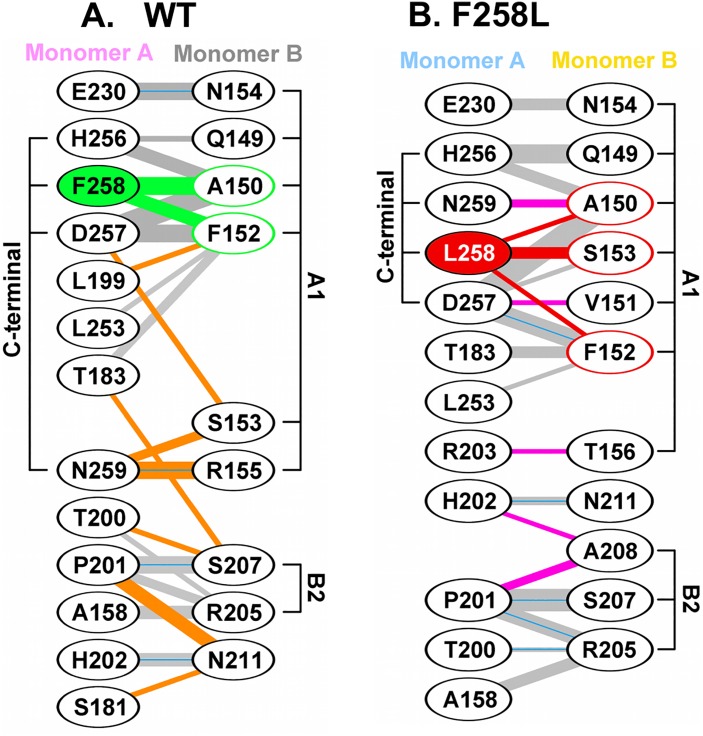
Fig 8. Diagrams depicting the interactions within the interfaces formed by the wild type and F258L OBDs.
A. Interactions between monomers A and B within the wild type JCV T-ag OBD, calculated using the program PDBSUM [57]. Residues within the A1 and B2 loops, as well as C-terminal regions, are indicated. Residue F258, and the interactions it makes with the second monomer, are shown in green. Hydrogen bonds are indicated by solid blue lines while non-bonded contacts are indicated by the gray lines (the width of the line is proportional to the relative strength of the interaction). Interaction that are unique to the wild-type are in orange. B. A diagram depicting the interactions between monomers A and B within the F258L mutant. Residue L258, and the interactions it makes with the second monomer, are shown in red. Interactions that are unique to the F258L mutant are in pink.

