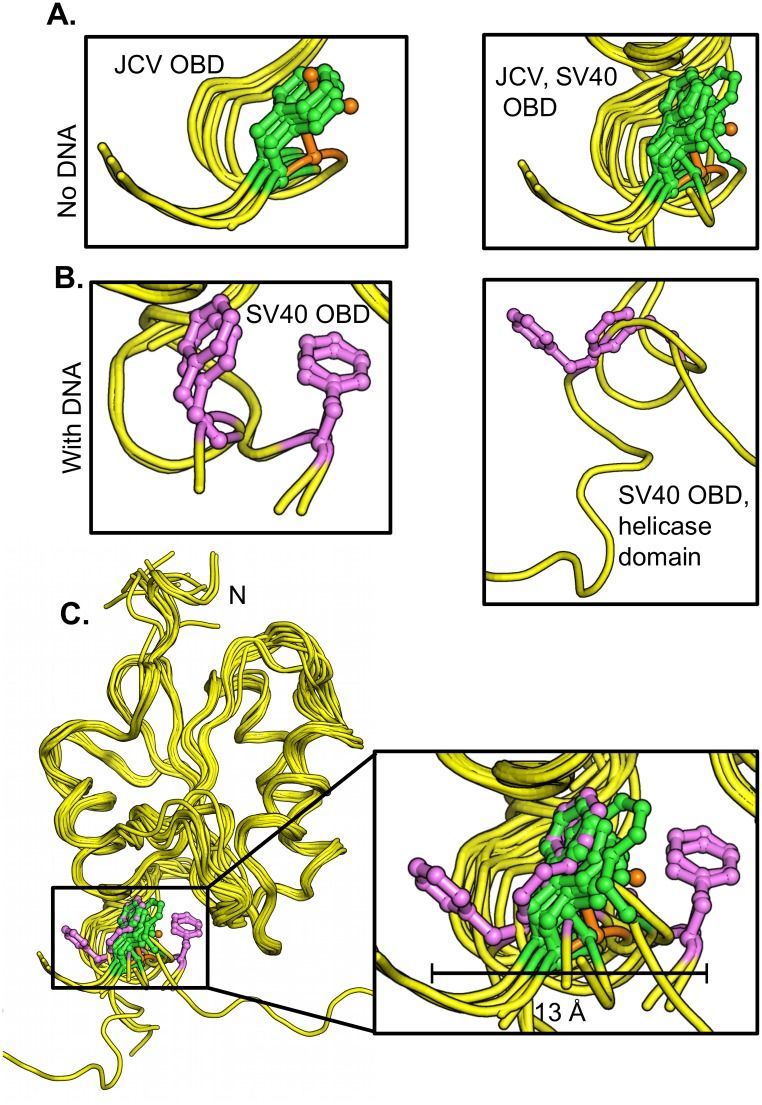
Fig 9. Structural based comparison of residue F258 in various polyomavirus T-ag OBDs.
A. (Left). Superposition of the apo structures of the JCV T-ag OBDs [42], including the structure of the JCV T-ag OBD F258L mutant (F258 in green, L258 in orange) indicating the position of residue 258. (Right). Superposition of all of the apo structures of the JCV and SV40 T-ag OBDs indicating the positions of JCV T-ag residue F258 and SV40 T-ag residue F257 (colored as above). B. (Left). Superposition of the DNA bound forms of the SV40 OBD [27, 28, 35], showing the location of T-ag residue F257 in magenta. (Right). The location of SV40 T-ag OBD residue F257 (magenta) in the T-ag131-627 crystal structure [31]. C. Superposition of all of the above SV40 and JCV T-ag structures showing the relative locations of F257/258 (colored as above). The insert depicts a close up of the three main orientations of residue 258 (257 in SV40); the central "apo position" and the two distal orientations (the distance seperating the distal orientations is indicated (~ 13 Å). PDB IDs used in these analyses were: 1) JCV T-ag OBD apo (4NBP, 4LIF, 4LMD), 2) SV40 T-ag OBD apo (2FUF, 2IF9, 2IPR, 2ITJ, 3QK2), 3) SV40 T-ag OBD co-structures with DNA (2ITL, 2NL8, 2NTC, 4FGN, 5D9I) and 4) the SV40 T-ag131-627 fragment with DNA (4GDF).

