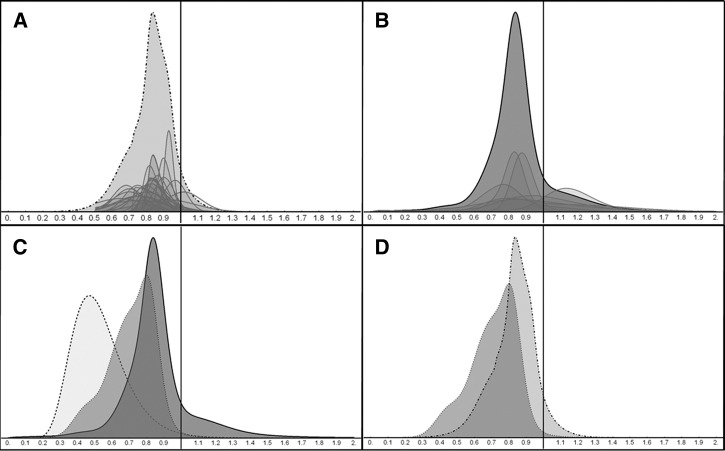
Figure 1.
Comparison of estimates of the relative risk of childhood mortality. In A–D, the x-axis represents the relative risk of childhood mortality. The y-axis is a unit-less density measure. A depicts the survey distribution, a probability density function created by pooling 28 skew-normal distributions fit to the questionnaire responses. The pooled function (light gray, dashed outline) is shown along with scaled-down representations of individual responses (darker gray, grey outline). B shows the Bayesian empirical prior distribution, which was calculated from meta-analysis of Cochrane reviews. The pooled function (dark gray, black outline) is shown along with scaled-down representations of the seven interventions (gray, gray outline). C shows the Bayesian analysis, which contains the empirical distribution as the prior probability (dark gray, black outline), the results of the Trachoma Amelioration in northern Amhara (TANA) study as the likelihood (light gray, dashed outline), and the resulting posterior probability (gray, dashed outline). D compares the survey distribution (light gray, dashed outline) to the Bayesian posterior (gray, dashed outline).

