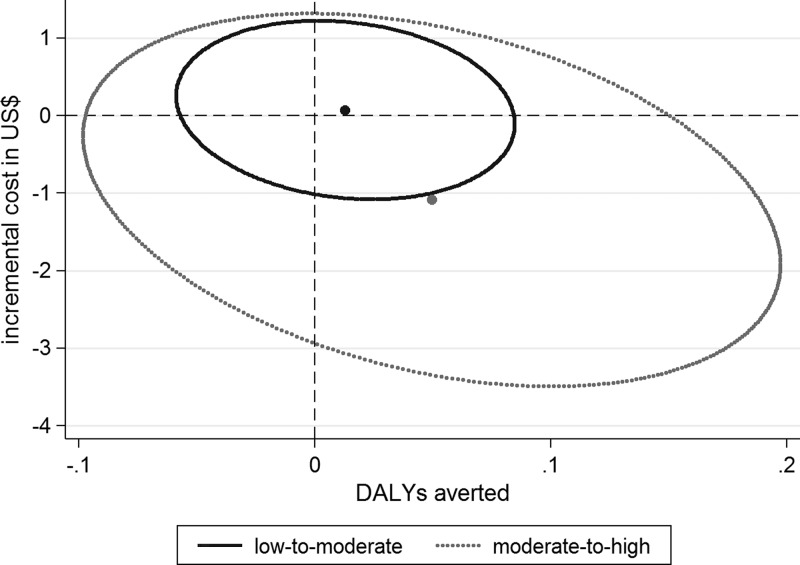
Figure 2.
Incremental costs and disability-adjusted life years (DALYs) averted across different malaria transmission settings (all costs are in U.S. dollars for the year 2013). The figure illustrates the mean number (dots) and 95% CI (ellipse) of DALYs averted and cost savings in U.S. dollars per child over a 1-year period.

