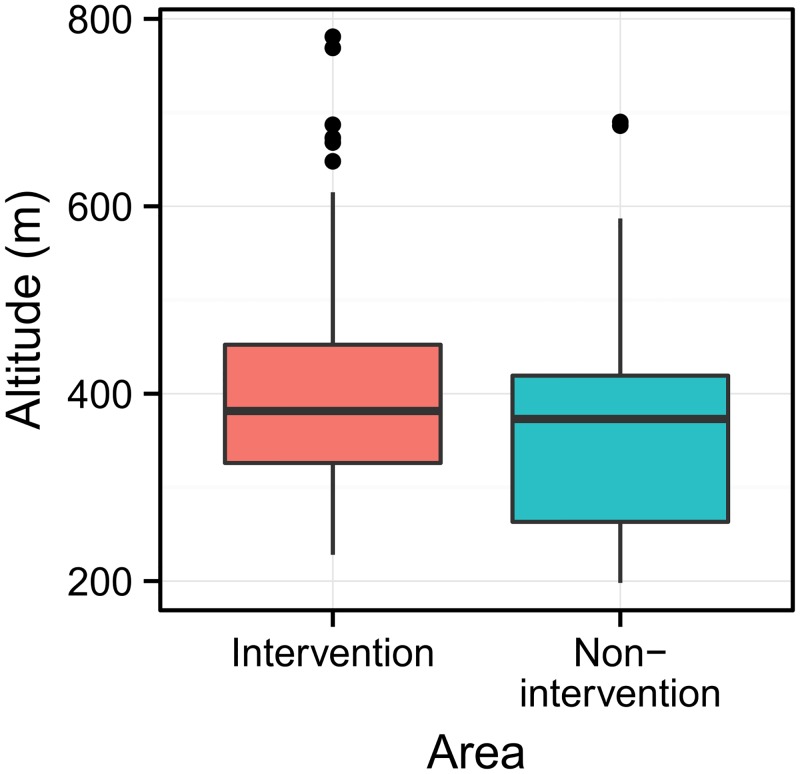
Fig 2. Altitude range of trap positions.
The boxplots show the distribution of the altitude above sea level for the 140 ovitraps in each of the two areas. The boxes represent the interquartile distances (IQD), while the centrelines through each box show the medians. The dots indicate outliers and the whiskers extend to the extreme values of the data, calculated as ±1.5 x IQD from the median.

