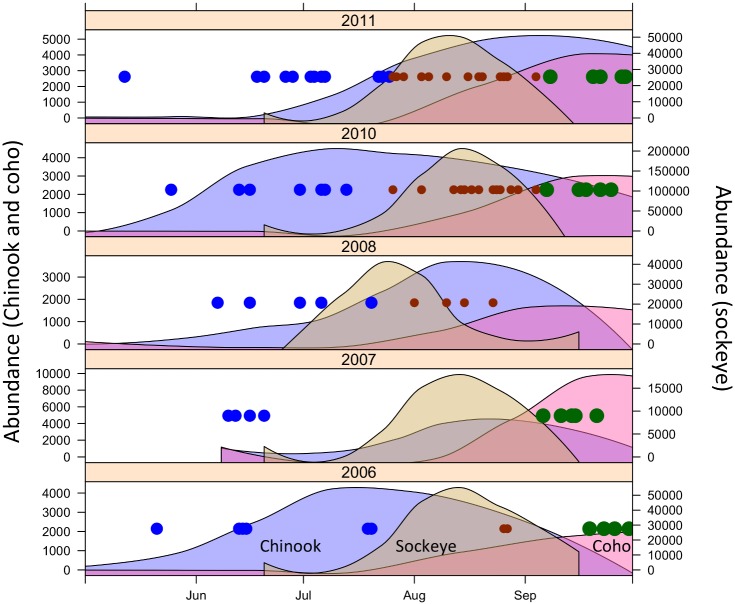
Fig 2. Temporal distribution of fecal samples included in the analysis and of the approximated daily abundance of Chinook, sockeye and coho salmon in the San Juan Islands area.
Each dot represents fecal samples collected on a specific day, with the area of the dot proportional to the number of samples on that day (smallest size = 1 sample). The dots are color-coded to indicate the within-year pools of samples that were combined for sequencing analysis, for a total of 13 year-by-season sample pools. Smoothed daily salmon abundance was estimated by local polynomial regression of daily catch-per-unit-effort data scaled by total annual run size (see S1 Text for details).

