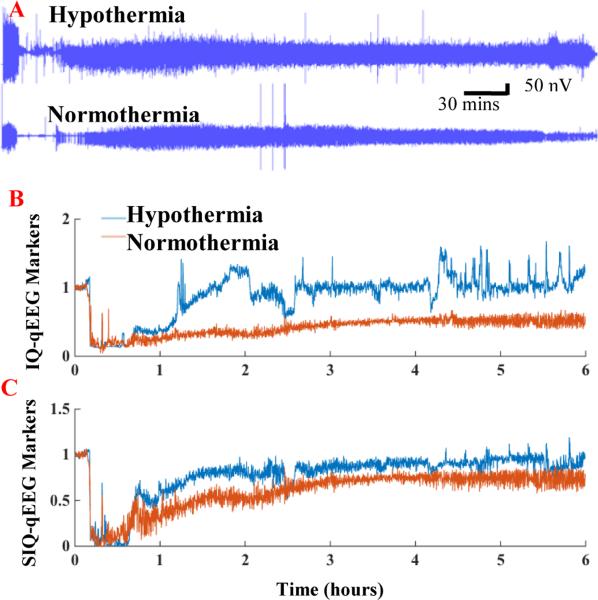
Figure 1.
Representative raw EEG data, information quantity (IQ) and sub-band information quantity (SIQ) plots from the hypothermia and normothermia groups. A: Raw EEG signals from Windaq under hypothermia and normothermia. B-C: The effect of hypothermia on EEG recovery was apparent with the analysis of IQ (in B) and SIQ (in C). Higher IQ was more evident in hypothermia group compared with normothermia. The high variability in IQ might be due to the HFO.

