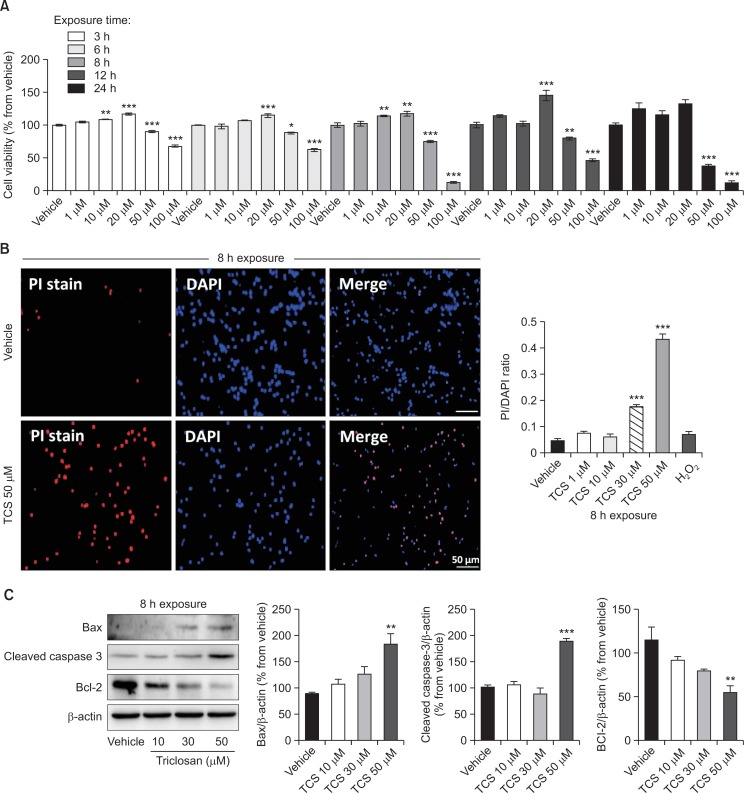
Fig. 1.
Cell viability of cultured rat NSCs treated with triclosan. Cell viability was assessed from the different concentrations and lengths of exposure of vehicle or triclosan treatment in culture through MTT reduction assay (A). PI staining and visualization were done to detect the spread of apoptosis in triclosan-treated cells exposed for 8 h (B). Bar size=50 μm. Western blot analysis was also conducted after 8 h exposure of NSCs to triclosan to detect the expression of cleaved caspase-3, Bax and Bcl2 proteins quantified by densitometry reflected as bar graphs (C). β-actin was used as the loading control. All experiments were individually performed during the 4th day of NSC culture in vitro (DIV 4). The results are shown as the percentage of proteins relative to the vehicle or the PI to DAPI ratio. Values are expressed as the mean ± S.E.M. *p<0.05, **p<0.01, ***p<0.001 vs. vehicle.

