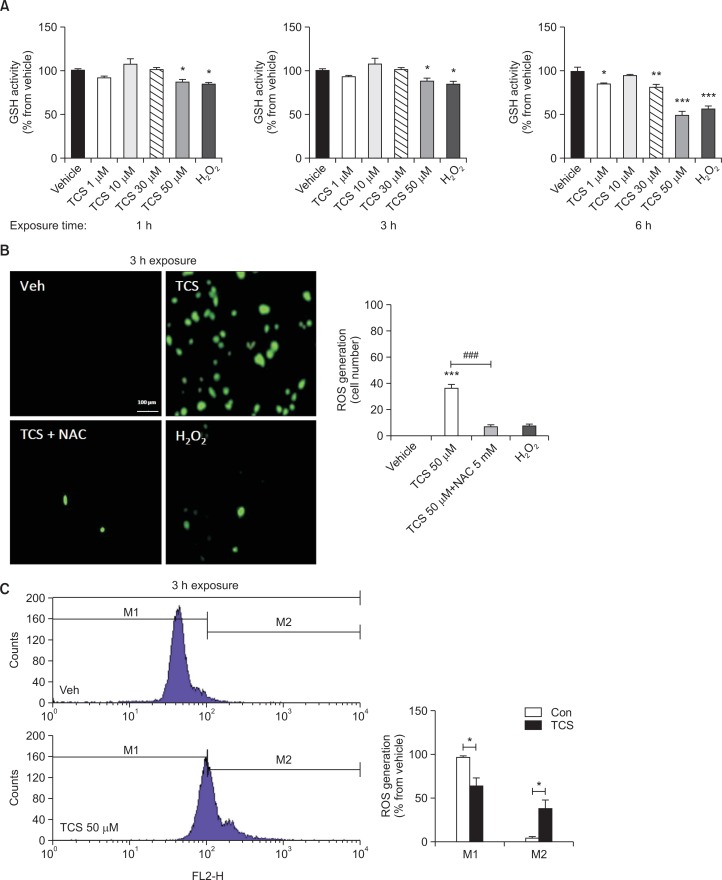
Fig. 2.
ROS generation profiles of cultured rat NSCs after triclosan treatment. GSH activity was measured in cells treated with vehicle or triclosan at different concentrations and time of exposures using the ROS assay (A). H2O2 was used as a positive control. ROS generation was also detected as a GFP using H2 DCF-DA assay after 3 h treatment of triclosan (B). NSCs were treated with either 50 μM TCS, 50 μM TCS+5 μM NAC or 200 μM H2O2 for 3 h. Histograms show the result of FACS analysis to further detect the levels of ROS generation in triclosan-treated rat NSCs (C). All experiments were individually performed during the 4th day of NSC culture in vitro (DIV 4). The results are shown as the percentage relative to the vehicle or the actual cell number. Values are expressed as the mean ± S.E.M. *p<0.05, **p<0.01, and ***p<0.001 vs. vehicle; ###p<0.001.

