
Figure 1.
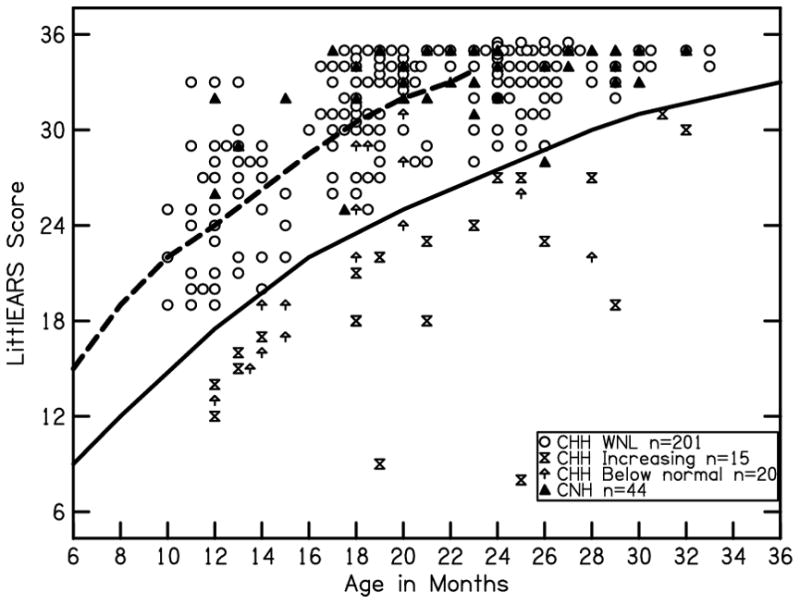
LittlEARS data for all subjects as a function of age in months as compared to normative range from Tsiakpini et al (2004). The solid line represents the lower bound of the 95% confidence interval for the LittlEARS normative range. The dashed line represents the average of the LittlEARS normative range. Open circles represent children who are hard of hearing (CHH) who were always within the normative range. Hourglass symbols represent CHH who were always below the normative range. Upward arrows represent children with scores below the normative range that increased into the normal range at subsequent visits. Black triangles represent children with normal hearing.