
Figure 6.
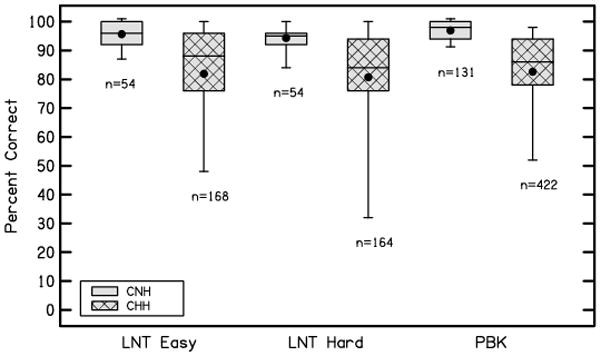
Performance on the LNT-Easy, LNT-Hard and PBK for CNH (gray) and CHH (hatched gray). The boxes represent the 25th-75th percentiles (interquartile range) and the whiskers represent the 5th and 95th percent confidence intervals of the mean. Solid lines are the median and solid circles represent the mean.