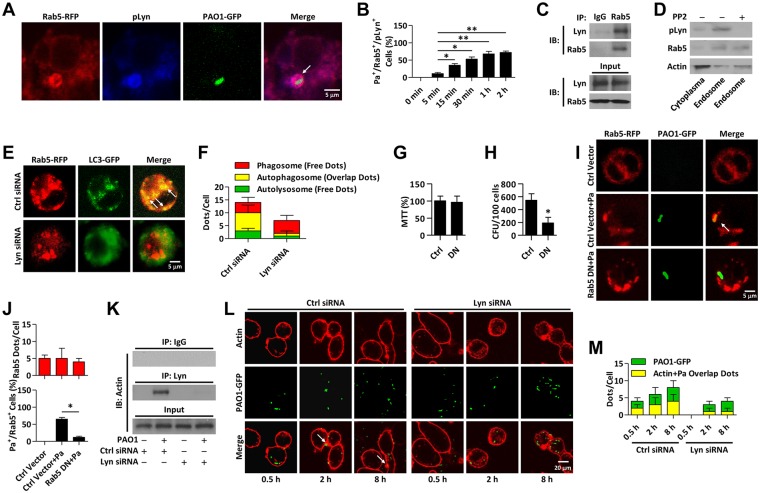
Fig 6. Lyn regulate infection-induced autophagy through Rab5.
(A) MH-S cells were transfected with Rab5-RFP for 24 h. Cells were infected with PAO1-GFP (MOI = 10, 1 h). Immunostaining was used to detect pLyn. Pa surrounded by Rab5 and pLyn was detected by confocal microscope. Scale bar = 5 μm. (B) The percentage of Rab5+/Pa+/pLyn+ colocalization (Rab5-RFP, PAO1-GFP, and pLyn puncta) is shown. Data are derived from 100 cells in each group. (C) MH-S cells were infected with PAO1 (MOI = 10, 1 h). Co-IP was performed to detect the protein interactions between Lyn and Rab5. (D) MH-S cells were pretreated with PP2 (5 nM, 30 min). Phagosomes were isolated and lysed for immunoblotting to detect pLyn and Rab5. (E, F) MH-S cells were co-transfected with Rab5-RFP and LC3-GFP as well as Lyn siRNA for 24 h, respectively. Cells were infected with PAO1 as above. CLSM imaging showed the localization (different puncta). Data are derived from 100 cells for each sample. Scale bar = 5 μm. (G, H) MH-S cells were transfected with Rab5-RFP or Rab5-DN-RFP plasmid for 24 h. Cells were infected with PAO1-GFP as above. Cell viability was determined using MTT assay and phagocytosis was performed by CFU assay. (I, J) CLSM imaging showed the localization of Rab5 and Pa. Scale bar = 5 μm. Rab5 puncta were counted in each cell. The percentage of Rab5+/Pa+ events (cell with colocalized puncta of Rab5-RFP and PAO1-GFP) is shown. Data are derived from 100 cells in each group. (K) MH-S cells were transfected with Ctrl or Lyn siRNA for 24 h, respectively. Whole cell lysates were immunoprecipitated (IP) with beads coated with Lyn antibody and immunoblotted with actin antibody. (L, M) Cells were infected with PAO1-GFP (MOI = 10) for different time. Polymerized actin was stained with rhodamine-phalloidin. Confocal microscopy showing rhodamine-phalloidin staining (red) around GFP-expressing Pa. Phagosomes containing degraded bacteria are heavily labeled for polymerized actin (white arrowheads). Scale bar = 20 μm. Internalized Pa and colocalized puncta were counted in each cell. Data are derived from 100 cells in each group. One-way ANOVA (Tukey’s post hoc); *, p<0.05.

