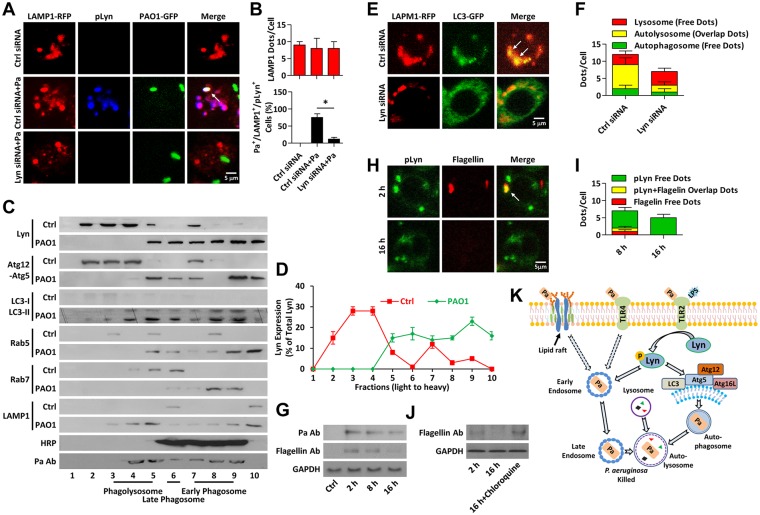
Fig 7. Lyn delivers bacteria to lysosome.
(A, B) MH-S cells were transfected with LAMP1-RFP for 24 h. After infected with PAO1-GFP (MOI = 10, 8 h), immunostaining was used to detect pLyn. Three colors overlap was detected by confocal microscope. Arrows indicate the colocalized puncta. LAMP1 puncta in each cell were counted. The percentage of LAMP1+/Pa+/pLyn+ events (cell with colocalized puncta of LAMP1-RFP, PAO1-GFP, and pLyn) is shown. Data are derived from 100 cells in each sample. (C) MH-S cells were infected by PAO1 as above and lysed for phagosome isolation by the sucrose density gradient method without detergent to keep the intracellular membranes intact. Phagosome fractions were resolved by SDS-PAGE and analyzed by immunoblotting with Lyn, Atg12-Atg5, LC3, Rab5, Rab7, LAMP1, and Pa Abs, respectively. (D) Lyn percent levels in different fractions were shown as means±SD. (E, F) MH-S cells were co-transfected with LAMP1-RFP, LC3-GFP, Ctrl or Lyn siRNA for 24 h, respectively. Cells were infected with PAO1 (MOI = 10, 1 h). CLSM imaging showed the localization of different puncta. Data are derived from 100 cells in each sample. (G) MH-S cells were infected with PAO1 (MOI = 10) for different times. Cell lysates were performed for immunoblotting with Pa and flagellin type b Abs, respectively. (H, I) Cells were infected with PAO1 as above. Immunostaining was used to detect pLyn and flagellin. The colocalization was detected by confocal microscope. The puncta were counted in each cell. Data are derived from 100 cells in each group. (J) MH-S cells were pretreated with Chloroquine (10 μM, 30 min). Cells were then infected with PAO1 as above for different times. Flagellin type b Abs was used to detect the digestion of bacterial proteins over time. (K) Schematic representation of Src kinase Lyn role in P. aeruginosa-induced autophagy. Upon Pa infection, free Lyn kinase in cytoplasm is activated and recruited to phagosome to facilitate autophagy derived phagocytosis. Data are shown as means+SD from three independent experiments. One-way ANOVA (Tukey’s post hoc); *, p<0.05. Scale bar = 5 μm.

