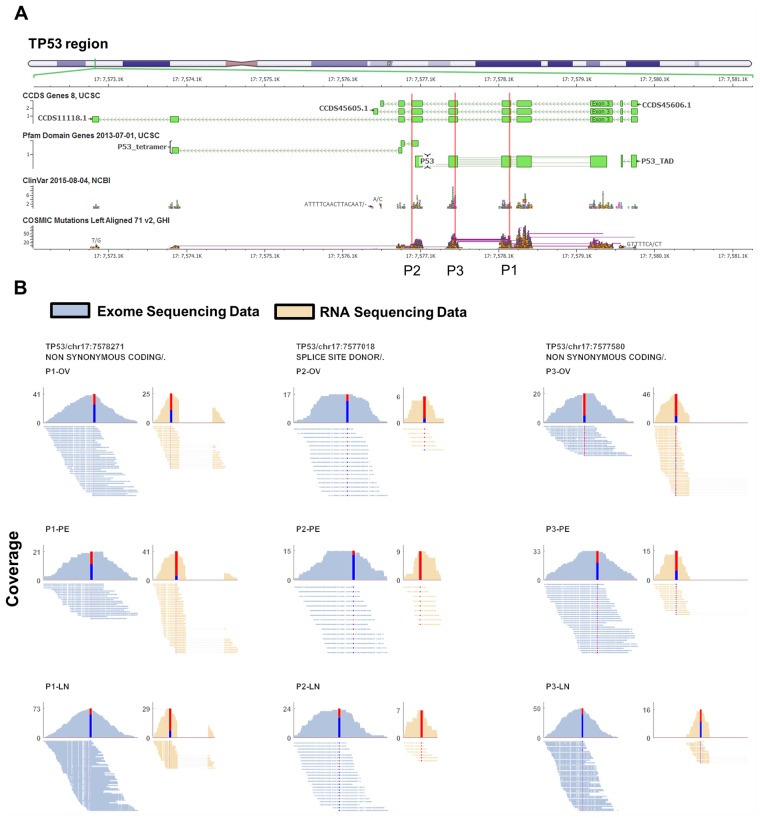
Fig 1. TP53 significant preferential allele expression.
We observed in three different patients (P1, P2, P3) alleles in TP53 where one allele is significantly preferentially expressed. A) The allele positions are shown on a schematic view of the TP53 gene (red line) for all three patients. B) Alignment and coverage plots of the reads spanning the preferentially expressed alleles for both exome (blue) and RNA (brown) sequencing data. The patient and site is indicated on each plot. The histograms indicate coverage across the site with the coverage indicated by the y-axis number. The histogram central stacked bar plot shows the number of reference allele reads in blue and the alternate allele reads in red. The alignment plot shows the individual reads spanning the preferentially expressed alleles. For the RNA sequencing data, the dashed line indicate gaps corresponding to a spliced region.

