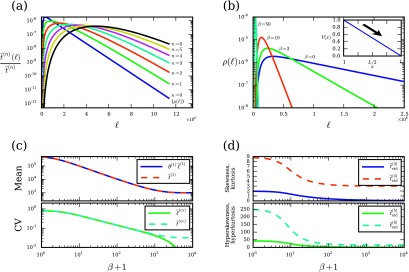
FIG. 2.
Distributions of path lengths and times on a 1D lattice. (a) The nth time moments for paths of length ℓ, normalized as fractions of the total moments , in the absence of a potential energy. (b) Path length probability distribution ρ(ℓ) for several choices of β on a linear energy landscape V(x) (inset). (c) The mean path length (scaled by the mean waiting time θ(1) = 1/2 for bulk states), mean path time , path length CV , and path time CV as functions of β. (d) Skewness , kurtosis , hyperskewness , and hyperkurtosis of path time as functions of β. Values of β in (c) and (d) are shifted by 1 to show β = 0 on a log scale. In all panels, we use a lattice of length L = 1000 with transition rates given by Eq. (63).

