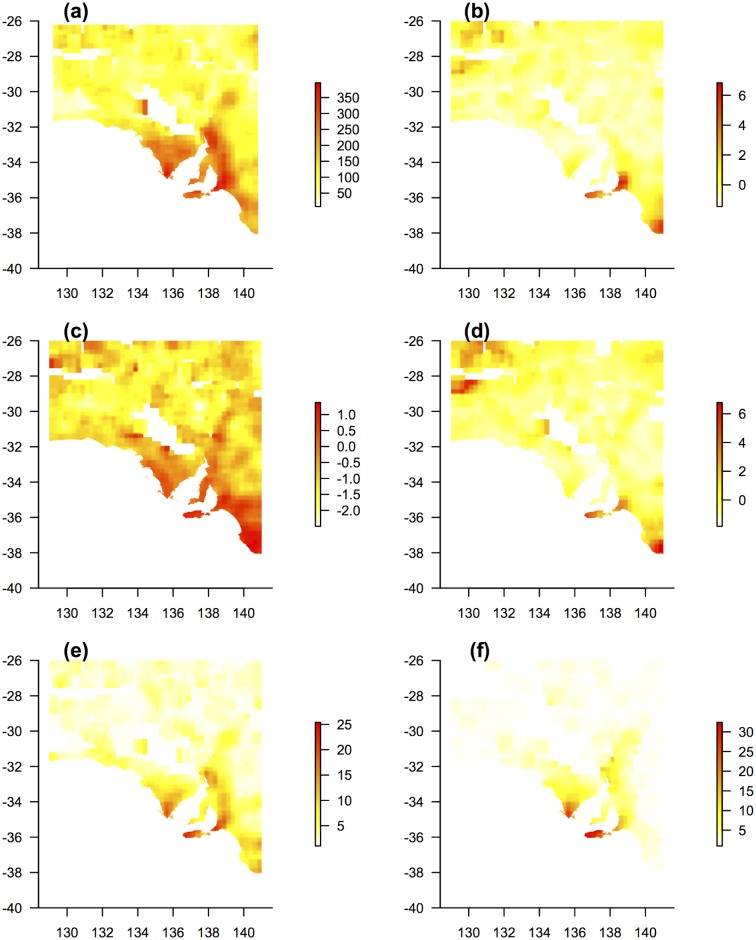
Fig 2. Maps of measured biodiversity metrics.
Maps are smoothed at a resolution of 1 km2 with values given per surrounding 0.25° x 0.25° area: (a) Estimated species richness based on non-parametric estimator (plot data); (b) georeferenced weighted endemism of native species (plot data)–continuous outlier metric; (c) phylogenetic diversity (plot data)–continuous outlier metric; (d) georeferenced phylogenetic endemism (plot data)–continuous outlier; (e) species richness of conservation-dependent species (plots); (f) species richness of categorical South Australian endemics (plot data).

