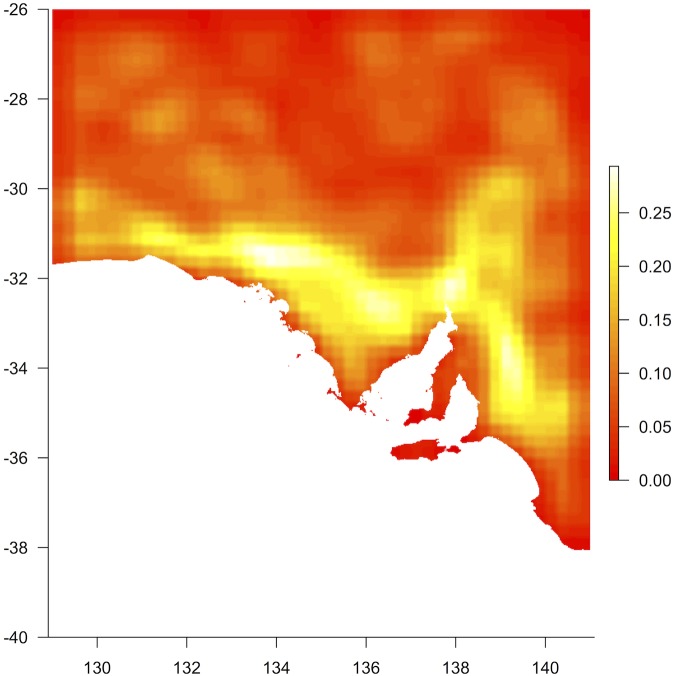
Fig 3. Beta diversity.
Here beta diversity is represented by the mean change in a Canonical Correspondence Analysis axis coordinate within a moving window of 3 x 3 grid cells, when this axis is constrained by ‘mean maximum temperature of the hottest month’ (combined data). Higher values represent more rapid turnover along the compositional axis.

