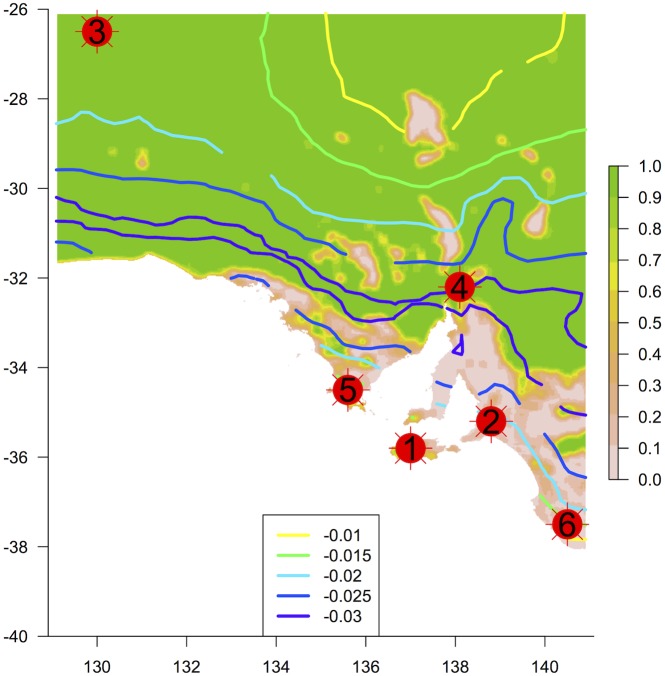
Fig 4. Identified centres of plant biodiversity.
The base raster map shows the proportion of remnant vegetation in a moving window (see Fig 1). Contours show the rate of change in species composition with spatial increases in temperature (predicted from a locally weighted nonlinear regression of the first CCA axis), where more negative slopes indicate higher climate sensitivity. Circles show locations of 6 centres referred to in Table 2. See Table 2 for more detail on the identified centres.

