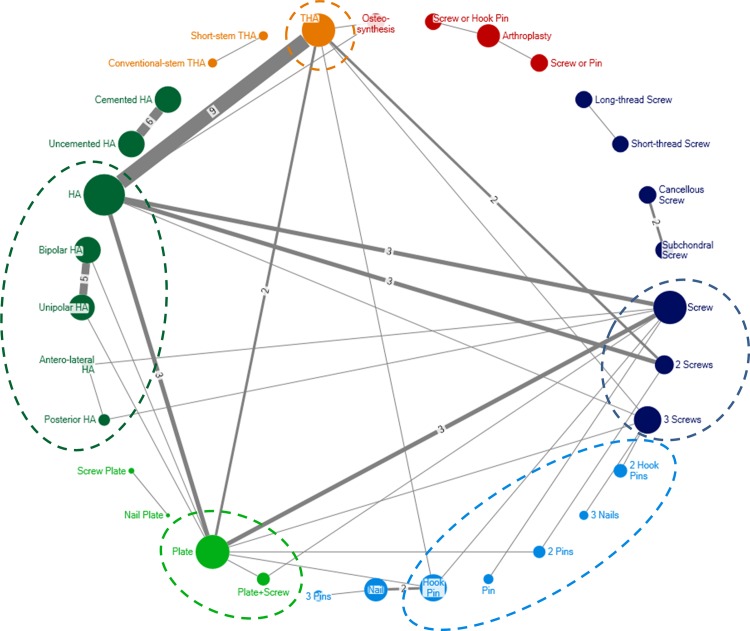
Fig 2. Network graph for 56 trials with interventions as labeled by the original trial authors.
Each node represents a treatment and each edge a randomized comparison of 2 treatments. Each edge is labeled with the number of randomized comparisons, except when there was a single trial assessing the corresponding treatment comparison. Ellipses show treatments that were grouped. Dark blue: screw treatment; light blue: unthreaded cervical osteosynthesis; light green: plate treatment; dark green: hemiarthroplasty; orange; total hip arthroplasty; red: nonspecific interventions (arthroplasty or osteosynthesis) and mixture of interventions (screw or pin). HA hemiarthroplasty; THA total hip arthroplasty.

