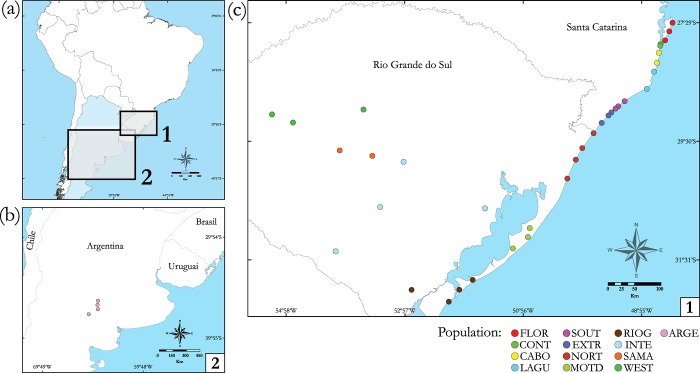
Fig 1. Map of South America with the geographic distribution of Acromyrmex striatus populations sampled.
(a) Map of the South American continent, (b) population collected in Argentina and (c) populations collected in Brazil. Each collection site is represented by a point, and the colors of the points indicate each population. These same colors used to represent each population were also present in the haplotype network.

