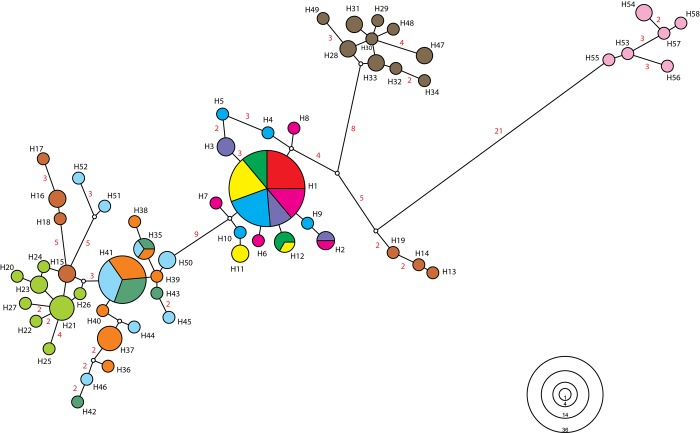
Fig 2. Genealogical relationship inferred for 58 haplotypes of the mitochondrial COI gene of Acromyrmex striatus estimated by the median-joining algorithm.
The areas are proportional to the frequency of haplotypes, which ranged from 1 to 36. Colors represent each population sampled, and correspond with the colors of Fig 1. The numbers of haplotypes of A. striatus correspond with those shown in Table 1. Numbers in red indicate mutational steps between haplotypes greater than one. Five haplogroups can be viewed. The small white circles represent lost or unsampled haplotypes.

