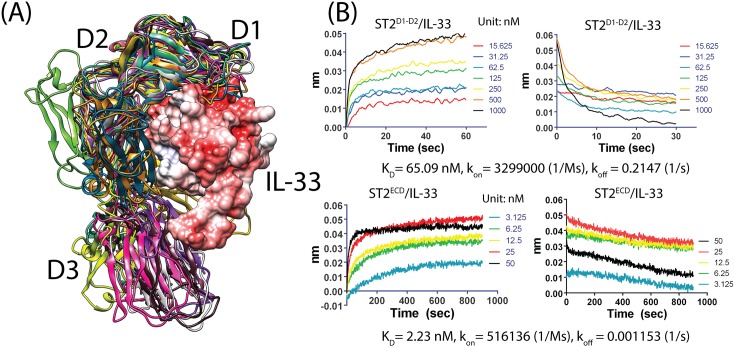
Fig 6. Alignment of the 12 representative conformations with ST2/IL-33 and the binding data of ST2 with IL-33.
(A) The D3 domains of the 11 conformations exhibit few clashes with IL-33 after alignment with the ST2/IL-33 structure. IL-33 is shown in surface representation and colored according to the electrostatic charge map where red and white color correspond to negative and neutral charged regions. (B) Binding data between ST2D1-D2, ST2ECD and IL-33 using Octet RED biolayer interferometry. Concentrations of IL-33 in nM used in the experiment, KD, kon and koff are provided.

