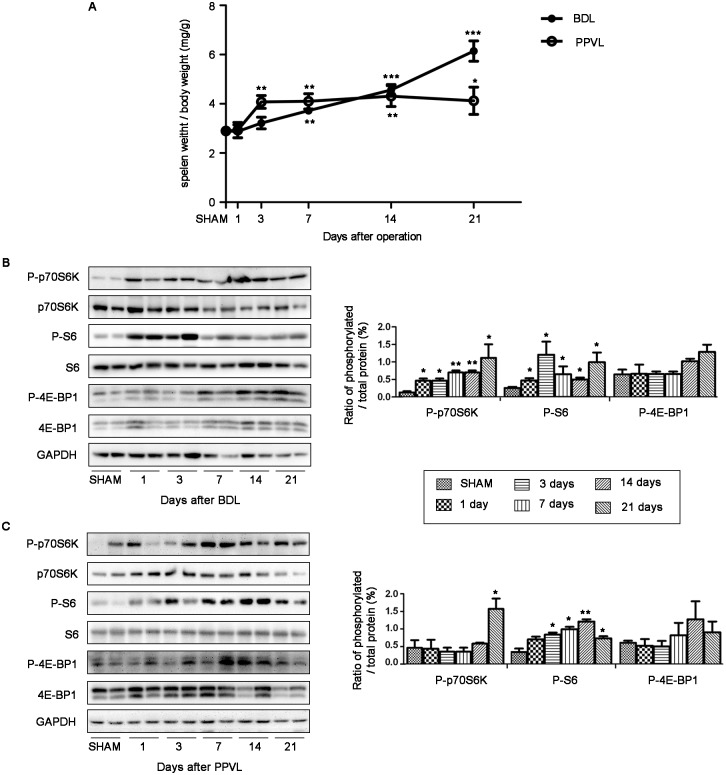
Fig 2. Splenomegaly development kinetics and mTOR signaling expression pattern in spleens of portal hypertensive rats.
(A) Relative spleen weight of rats on days 1, 3, 7, 14 and 21 after BDL or PPVL (n = 4 in each group). (B) and (C) Representative images of western blot and quantification of protein expression relative to their total protein for mTOR down-stream effectors in spleens of BDL and PPVL rats. *p<0.05 versus SHAM, **p<0.01 versus SHAM, ***p<0.001 versus SHAM.

