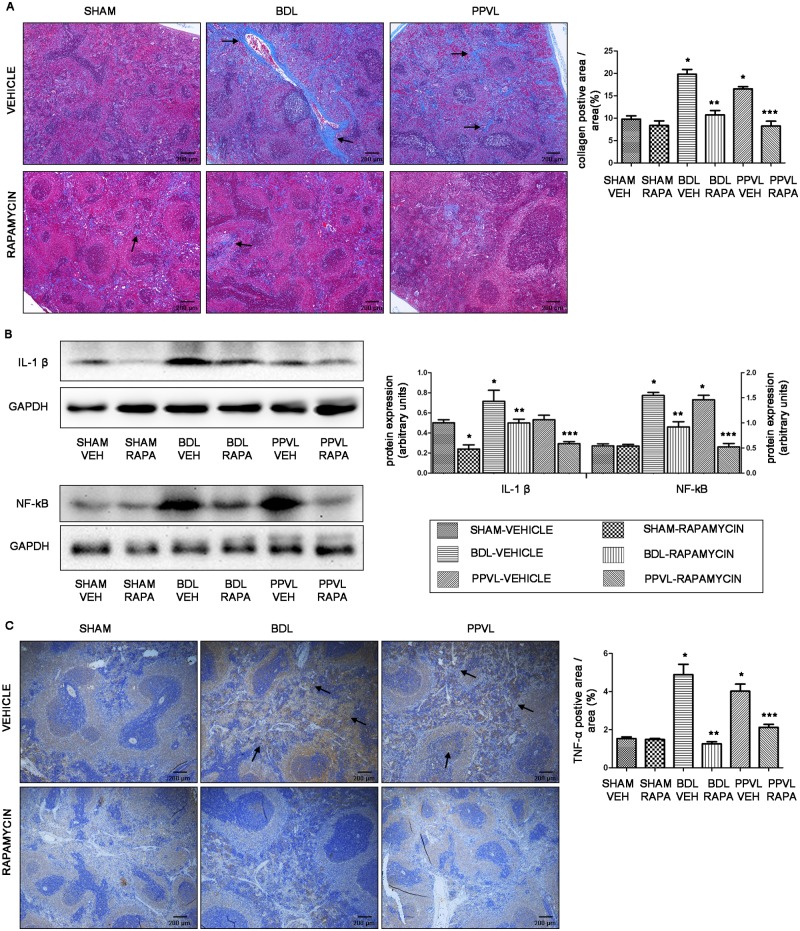
Fig 6. Effects of rapamycin on fibrosis and inflammation in splenic parenchyma in portal hypertensive rats.
(A) Representative Masson trichrome staining images (original magnification ×40) and quantitative analysis of fibrillar collegan-stained area. Arrowheads point to fibrillar collagen. (B) Representative images of western blot and quantification of protein expression relative to GAPDH for IL-1β and NF-κB. (C) Representative images of spleen tissues immunostained for TNF-α (original magnification ×40) and quantitative analysis of TNF-α-positive cells area. Arrowheads point to TNF-α-positive cells. *: p<0.05 versus SHAM-VEH, **: p<0.05 versus BDL-VEH, ***: p<0.05 versus PPVL-VEH.

